Amid tariff uncertainty, corporate profits offer stocks fundamental support
ANTHONY SAGLIMBENE – CHIEF MARKET STRATEGIST, AMERIPRISE FINANCIAL
WEEKLY MARKET PERSPECTIVES — March 3, 2025

Despite a late Friday rally, stocks ended last week lower amid continued investor concerns regarding tariffs, a loss of momentum across Big Tech, and anxiety that growth is slowing more than expected. During the week, the Magnificent Seven briefly fell into a correction (defined as a decline of 10% or more from a recent market top), while small-cap stocks are now down 12% off their November highs.
With how markets might react to potential 25% tariffs on all imports from Canada and Mexico going into effect early in the week, an additional 10% tariff on all Chinese imports, and February jobs data later in the week, there’s certainly no shortage of items for investors to sort through in the days ahead.
Last week in review:
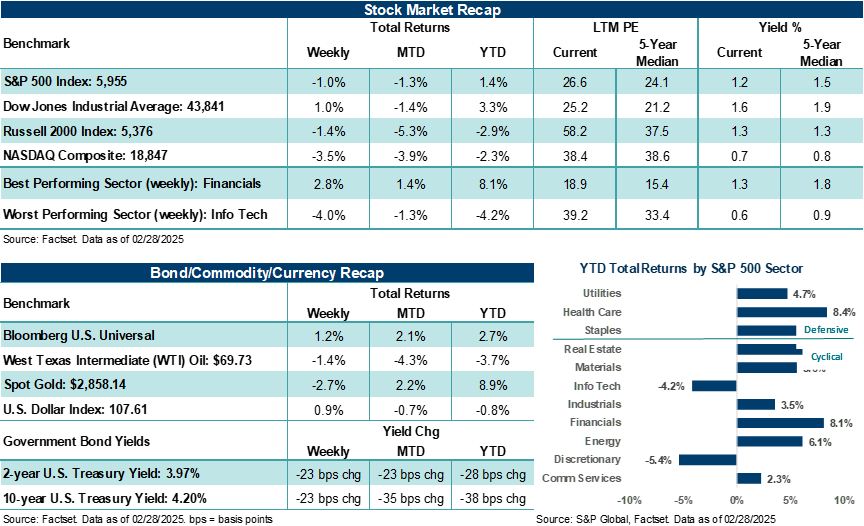
- The S&P 500 Index closed the week lower by 1.0%, finishing down for the second straight week and posting its worst two-week run since early September. In February, the Index lost 1.3%, posting its largest monthly point and percentage drop since December.
“As markets continue to focus on near-term volatility factors associated with tariffs, policy, and Big Tech, profit conditions across several areas of the market could offer fundamental support for investors who are willing to look through potential short-term dislocations.”
Anthony Saglimbene - Chief Market Strategist, Ameriprise Financial
- The Magnificent Seven (i.e., Tesla, Microsoft, Amazon, Alphabet, Apple, NVIDIA, and Meta Platforms), or the companies that have fueled Big Tech’s rise and powered major U.S. stock averages higher over the last two years, briefly dipped into a correction last week — a first since August/September. Pressure across this group led to the NASDAQ Composite falling 3.5% last week and ending February lower by nearly 4.0% (its worst month since April).
- Notably, NVIDIA’s solid earnings report for the previous quarter and strong outlook for revenue and demand for its advanced artificial intelligence chips over the coming quarters failed to lift momentum and turn the tide on Technology stocks as well as the broader market. NVIDIA fell over 7.0% last week but ended February higher by almost +4.0%. That said, Tesla (-27.6%), Alphabet (-16.5%), and Amazon (-10.8%) experienced heavy selling pressure in February and weighed on major U.S. stock averages all month.
- Pressure across the Dow Jones Industrials Average was less pronounced, with the Dow 30 closing the week higher by +1.0% and February down 1.4%. The Russell 2000 Index continues to struggle amid tariff and growth concerns, falling 1.4% last week and ending February down 5.3%. Along with the NASDAQ, the Russell 2000 is lower two months into 2025.
- U.S. Treasury yields fell aggressively last week as investors sought safety in government bonds.
- In February, West Texas Intermediate (WTI) crude posted its first monthly loss since November, the U.S. Dollar Index fell less than 1.0%, and Gold ended higher.
- February consumer confidence posted its largest monthly drop since August 2021. The Citi Economic Surprise Index (measuring whether economic data is coming in better or worse than expected) fell into negative territory. At the same time, the Atlanta Federal Reserve GDPNow forecast for the first quarter shows the U.S. economy contracting by 1.5%. Note: strong import activity ahead of potential tariffs is likely influencing this figure at the moment. In our view, this influence should moderate as imports move to inventories, consumption, or capital expenditures by the time the first advance reading of Q1’25 GDP is provided in April. We forecast the U.S. economy will grow by +1.6% in the first quarter.
- The latest read on the core Personal Consumption Expenditures (PCE) Price Index showed the Federal Reserve’s preferred inflation gauge coming in at an annualized rate of +2.6% for January, in line with expectations and below December’s level of +2.9%. Personal income rose more than expected in January, while personal spending slightly missed estimates. Notably, Moody’s Analytics recently found that the wealthiest 10% of American households (those making $250,000 a year or more) now account for half of all U.S. consumer spending and at least one-third of the country’s total GDP. Not since 1989 have the top-decile earners in America accounted for such a large share of overall consumer spending. Although top earners usually account for a majority of the consumer spending in the U.S. each year, their influence, and thus potential impact on slowing growth should they decide to reign in their spending, is an obvious risk to markets, corporate profitability, and economic growth.
- Finally, approaching tariffs on Canada, Mexico, and China, as well as President Trump’s threats of 25% tariffs on the European Union in April, kept fiscal policy uncertainty high last week. House Republicans passed a framework for a budget resolution, which includes room to extend the 2017 tax cuts, reduces spending by $1.5 trillion over ten years, and provides funding for defense and security while raising the debt ceiling by $4 trillion. And, notably, the world watched on Friday the relationship between President Trump and Ukraine President Zelensky unfold on television as both men could not find common ground on a minerals deal which was expected to pave the way to a broader peace agreement with Russia.
Amid the tariff uncertainty and stock volatility, corporate profits offer fundamental support under the surface.
Volatility across stocks has risen this year, largely due to elevated expectations/valuations for a few mega-cap U.S. companies, anxiety about tariffs and their influence on growth/inflation, and falling consumer/investor confidence levels. And while pressure across Magnificent Seven companies, industries closely tied to tariff impacts, and the Russell 2000 Index has been biting this year, the broader S&P 500 has remained relatively resilient. Note: The S&P 500 ended last week roughly 3.0% away from its all-time high.
Importantly, nine of the S&P 500’s eleven sectors are higher in 2025, which collectively represent nearly 60% of the Index. A stable economic environment, solid consumer/business trends, and growing profits have helped support areas of the market where trends are expected to improve this year and expectations aren’t so stretched.
Outside of Energy, Materials, and Consumer Staples, profits for S&P 500 sectors are expected to rise in the first quarter, with Information Technology, Healthcare and Communication Services forecasted to see outsized profit growth. Yet, first quarter earnings expectations for a host of S&P 500 sectors have fallen meaningfully since the end of December, particularly in cyclical areas outside of Technology that were expected to see more robust growth at the start of the year. Under the surface of the front and center issues facing the market, which are routinely covered in headlines and commentary, falling profit expectations for the first quarter have also been a headwind for broader U.S. stock averages.
That said, analysts continue to see an environment where corporate profitability remains positive at the start of the year. As discussed above, during the fourth quarter earnings season, expectations for the current quarter were lowered, which means the hurdle rate for companies to surpass profit forecasts has become easier to achieve. For example, at the end of December, Q4’24, S&P 500 earnings per share (EPS) were expected to rise roughly +11.5% on an annualized basis. With 97% of S&P 500 fourth quarter reports now complete, blended earnings per share (EPS) growth is higher by +18.1% year-over-year — well above forecasts at the end of last year.
Bottom line: S&P 500 companies, in aggregate, routinely surpass analyst estimates in normalized environments and where economic conditions are stable. Obviously, tariffs and other fiscal/monetary unknowns at the moment are a risk to maintaining stable economic conditions and, thus, corporate profits that can surpass expectations. Nevertheless, as markets continue to focus on near-term volatility factors associated with tariffs, policy, and Big Tech, profit conditions across several areas of the market could offer fundamental support for investors who are willing to look through potential short-term dislocations.
The week ahead:
Tariffs, jobs data, and looks at manufacturing and services activity line the week.
- President Trump is scheduled to hit Canada and Mexico with 25% tariffs on all imports to the U.S. on Tuesday and China with an additional 10% tariff. The President will address a joint session of Congress on Tuesday at 9 pm EST, his first speech to Congress of his second term.
- Despite all the headlines on DOGE and government layoffs, its influence on this week’s employment reports will not play much, if any, factor in the results. February private ADP payrolls (Wednesday) are seen modestly declining from January levels. Friday’s closely watched February nonfarm payrolls report is expected to show job gains of +158,000, up from +143,000 in January. The unemployment rate last month is expected to hold steady at 4.0%.
- February ISM manufacturing and services reports on Monday and Wednesday, respectively, should show trends in each didn’t change much from January.