Investing amid potential trade wars necessitates a proactive plan
ANTHONY SAGLIMBENE – CHIEF MARKET STRATEGIST, AMERIPRISE FINANCIAL
WEEKLY MARKET PERSPECTIVES — March 10, 2025

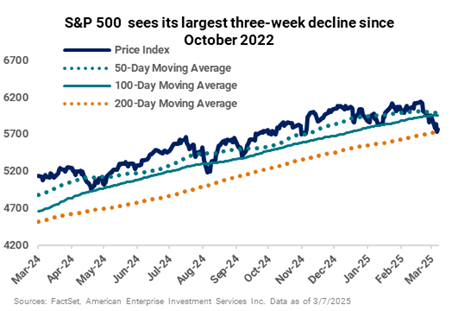
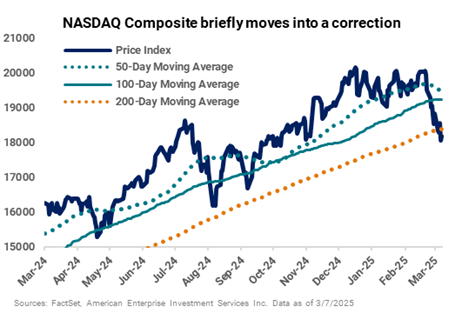
Selling pressure across the market continued last week, as tariff headlines sapped investor confidence and technology stocks weighed on major U.S. equity averages. The S&P 500 Index recorded its third straight week of declines and is currently on its worst losing streak since the week ending October 7, 2022. Notably, the NASDAQ Composite briefly fell 10% from its recent high, hitting a technical correction on Thursday before rebounding a bit on Friday. On-again, off-again tariff announcements from the White House elevated confusion across the market, and U.S. labor trends remained on firm footing last month.
This week, inflation reports, job openings data, and a preliminary look at March University of Michigan consumer confidence will take the economic spotlight. However, tariff uncertainty, Washington drama around a budget resolution, and reactions to evolving stock conditions are also likely to take up a lot of oxygen this week.
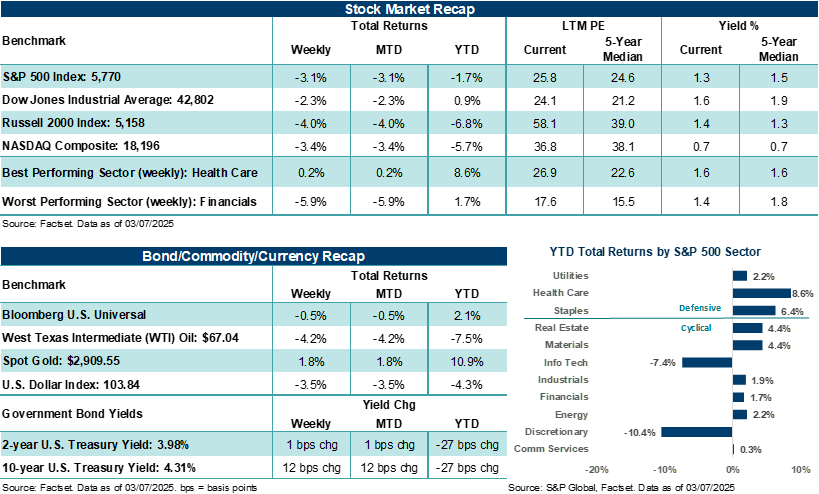
Last week in review:
- The S&P 500 Index finished lower by 3.1%, its worst week since September 2024. The Index is now down 5.6% over the last three weeks and is off roughly the same amount from its all-time high in February. However, it’s important to note that 5% - 10% drawdowns across major averages are not uncommon for stocks and tend to form around periods where policy or economic uncertainty is elevated.
“Simply put, Trump believes the U.S. is being taken advantage of by some of our closest trading partners, and he is looking to reset how America trades with the rest of the world. His tool to exact change and rebalance trade between the U.S. and the rest of the world? Tariffs.”
Anthony Saglimbene - Chief Market Strategist, Ameriprise Financial
- The NASDAQ Composite ended the week down 3.4%. The tech-heavy index briefly hit correction territory on Thursday (i.e., down 10% or more from its high) before finishing the week 9.9% off its December high. At one point during the week, Magnificent Seven stocks collectively were down more than 15% from their highs, while the Philadelphia Semiconductor Index entered a “bear market” (i.e., down more than 20% from its highwater mark). Although near-term conditions may continue to keep tech stocks volatile, such declines have historically offered attractive entry points for longer-term investors willing to ride out the ups and downs.
- The Dow Jones Industrials Average (-2.3%) and the Russell 2000 Index (-4.0%) also struggled during the week. Small-cap stocks are now down roughly 7% in 2025 and off almost 16% from their November high.
- U.S. Treasuries put in mixed performance across the curve, with yields on the 2-year and 10-year moving higher.
- The U.S. Dollar Index ended sharply lower across the major currencies, and West Texas Intermediate (WTI) crude fell for the seventh consecutive week. Gold finished higher.
- Concerns about a major global trade war took hold, as President Trump ordered 25% tariffs on Canada and Mexico to take effect while upping the tariff rate on China imports to 20% from 10%. However, Trump quickly rolled back tariffs on all United States-Mexico-Canada Agreement (USMCA) goods for one month before threatening Canada on Friday with as high as 250% tariffs on lumber and dairy imports. To be fair, such U.S. tariffs would match Canada’s existing levies on dairy but, in our view, would have a limited impact on the U.S. economy if enacted. That said, trade volume between all three countries totaled $1.8 trillion in 2022, with much of the volume coming through USMCA. Yet, the high degree of uncertainty associated with nearly daily tariff threats/announcements/retaliatory responses and the lack of a well-thought-out communication strategy from the White House has quickly unnerved investors and lowered confidence in growth outlooks for this year. As a result, stocks have come under increasing pressure. And let’s not forget that President Trump has yet to turn his tariff focus on the European Union, and reciprocal tariffs are set to begin on April 2.
- On the U.S. labor front, nonfarm payrolls grew by a healthy +151,000 last month, slightly below consensus, while the unemployment rate ticked higher to 4.1% from 4.0% in January. Federal employment shed 10,000 jobs in February, yet the bulk of the DOGE layoffs likely won’t show up in the jobs report until May through September. And while federal government employment accounts for just 2% - 3% of the nonfarm payrolls report, government layoffs last month contributed to the Challenger report seeing its highest level of year-to-date layoffs since 2009.
- Finally, the European Central Bank (ECB) cut its policy rate for the fifth consecutive meeting and the sixth time since June 2024. However, policymakers may be more cautious about cutting as its policy rate approaches a more neutral level. And amid rising global threats, Germany’s new government plans to significantly boost defense spending and relax some of its restrictions on debt funding.
A potential trade war isn’t coming out of the blue. Have a plan for your investments.
In our view, President Trump is doing exactly what he campaigned on when it comes to tariff threats, and in part, recent actions and announcements are why a majority of Americans gave him a second term in the White House. Simply put, Trump believes the U.S. is being taken advantage of by some of our closest trading partners, and he is looking to reset how America trades with the rest of the world. His tool to exact change and rebalance trade between the U.S. and the rest of the world? Tariffs. Notably, major U.S. stock averages are now lower since election day, with stocks significantly off their recent highs and trading below their near and longer-term trend lines. In our view, the “magnitude” of the levies being put forth, the seemingly “evolving” near-term objectives the White House is attempting to accomplish, and the still undetermined effects of tariffs on the U.S. economy are what have recently sapped stock momentum.
Bottom line: The White House tariff strategy is currently beginning to erode confidence in future growth, trade stability, sentiment, and consumer and business spending outlooks, which, by the way, were all forecasted by many at the end of last year to be relatively solid in 2025 — partly based on the prospects for increased fiscal tailwinds such as lower taxes and less regulation. At least at present, the fiscal tailwinds investors assumed would help lift stocks this year have taken a backseat to aggressive tariff actions and announcements that are now weighing on equity prices. Unfortunately, we do not believe this environment is likely to change over the near-to-intermediate term, which could make investing difficult.
For investors trying to navigate through the uncertainty, well-established portfolio diversification strategies, high-quality equities, cash, fixed income, alternatives, income-producing strategies, and real assets can all help mitigate risk and possibly provide a little ballast in a portfolio should near-term equity pressure continue. And at some point, investors may want to consider using the dislocation in stocks to their benefit, either through dollar-cost averaging strategies or rebalancing efforts.
What we suggest: Have a candid conversation with your Ameriprise financial advisor about your current investments, allocation, and risk tolerance. How would you feel if your portfolio dropped 5% or 10% from here? Is that an opportunity to invest more? And where would you invest new money? Or would such declines cause you concern or change your investment strategy? Your advisor can help answer these questions and structure a “proactive” approach to address current market volatility and keep your portfolio on track with your goals and objectives.
The week ahead:
Consumer and producer inflation reports are expected to show some moderation in February, and a first look at March University of Michigan consumer sentiment could show a modest uptick from February levels.
- On an annualized basis, Wednesday’s headline Consumer Price Index (CPI) is expected to tick lower to +2.9% in February from +3.0% in January. February core CPI (ex-food and energy) is forecast to drop to an annualized rate of +3.2% from +3.3% the previous month. Yet, even if consumer inflation and producer prices (reported on Thursday) see slight declines, the Federal Reserve is likely to hold rate policy steady when it meets next week.
- Investors will be looking to see how consumers feel about their personal situation in the latest U of M survey (report on Friday) following the last few weeks of market volatility and tariff headlines. In February, consumer sentiment declined meaningfully across all demographic groups, including age, income, and wealth, as concerns about inflation and tariffs rose significantly over January levels.
- In order to avoid a U.S. government shutdown, Congress will need to pass another continuing resolution before March 14. Republicans are working on a proposal that would fund the government through the fall while reducing spending.