Investors are currently navigating in unsettled waters
ANTHONY SAGLIMBENE – CHIEF MARKET STRATEGIST, AMERIPRISE FINANCIAL
WEEKLY MARKET PERSPECTIVES — Febuary 10, 2025

Stocks took a rollercoaster ride last week as tariff drama, earnings and economic releases, and falling consumer sentiment weighed on markets.
This week, investors will dial in on inflation updates to help add color to forward Federal Reserve policy expectations.
Last week in review:
-
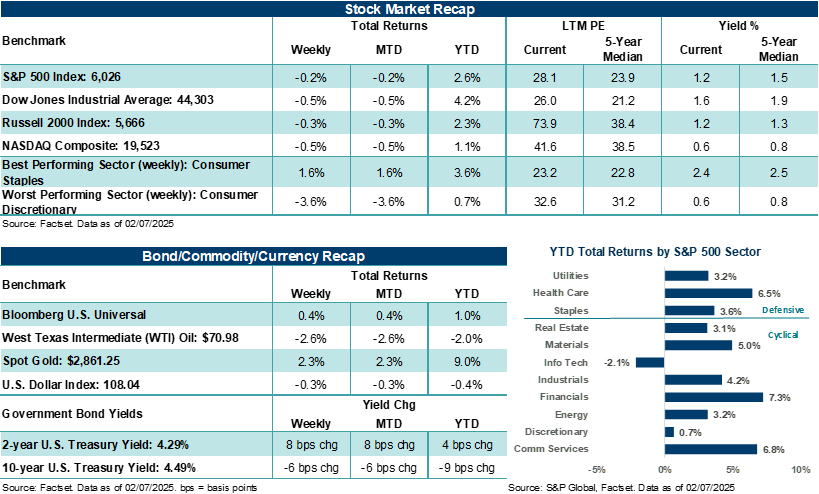
The S&P 500 Index fell 0.2%. The Dow Jones Industrials Average and NASDAQ Composite fell roughly 0.5%. However, the rather sanguine weekly declines mask larger moves to the downside and upside during the week. The Russell 2000 Index lost 0.4%.
- The 10-year U.S. Treasury yield ended near 4.5%, and Gold hit a record high on Friday, gaining +2.3% for the week.
- The U.S. Dollar Index fell for the third straight week, and West Texas Intermediate (WTI) crude lost 2.6%.
“We believe the AI secular trend remains well-intact, profit growth for Big Tech should remain strong in 2025, and some volatility should be expected in these stocks, though it shouldn't detract from their longer-term opportunities to profit from the early stages of AI expansion.”
Anthony Saglimbene - Chief Market Strategist, Ameriprise Financial
- On the employment front, the U.S. economy added +143,000 jobs in January, while November and December job gains were revised higher by a cumulative +100,000. The unemployment rate stood at 4.0% last month.
- January ISM Manufacturing hit its highest level since September 2022, expanding for the first time in 26 months. And while ISM services missed estimates for January, the critical read on the state of economic activity in the U.S. remained firmly in expansion mode last month.
- A preliminary look at February Consumer Sentiment unexpectedly declined, moving lower for the second straight month and hitting its lowest level since July.
- Finally, on the earnings front, Alphabet, Amazon, and AMD results/outlooks weighed on stock benchmarks. Though results for the previous quarter were solid, investor concerns about capex spending and data center/cloud demand pressured the stocks post-reports.
What has investors unsettled at the moment?
Big Tech earnings for the previous quarter were solid, but AI spending plans have investors more cautious. Profit growth for the Magnificent Seven in the final quarter of 2024 generally came in as expected and, in several cases, surpassed analyst estimates. However, China's DeepSeek artificial intelligence model, which allegedly was created for far less money to train and build than American AI, has recently sent shockwaves across Big Tech. This has caused mixed reactions to Big Tech's profit results and outlooks during the latest earnings season. As a result, investors are starting to call into question Big Tech’s spending spree to spur the development of AI in the U.S. In fact, Meta Platforms, Amazon, Alphabet, and Microsoft intend to spend a staggering $320 billion combined on AI infrastructure in 2025, according to company filings and CEO comments.
Although markets have somewhat discounted DeepSeek developments, and companies like Meta Platforms and Alphabet have reiterated the need to spend aggressively on AI to compete, investors have begun to more closely scrutinize the near-term profit outlook, given high expectations, elevated valuations and massive spending on AI. That said, we believe a little reset in expectations would be healthy longer-term and likely warranted, given how far this select group of stocks has run since the end of 2022.
Bottom line: We believe the AI secular trend remains well-intact, profit growth for Big Tech should remain strong in 2025, and some volatility should be expected in these stocks, though it shouldn't detract from their longer-term opportunities to profit from the early stages of AI expansion.
Tariffs — are they on or off? Unfortunately, it's a question that investors may be grappling with for some time, adding an element of uncertainty in the market that makes forecasting growth, profits, and global trade dynamics very difficult to predict. Starting last week, the White House announced it would impose a 25% levy on all Canadian and Mexican imports, a 10% tariff on Canadian oil, and a 10% tariff on all imports from China. In response, Canada announced retaliatory tariffs of 25% on $105 billion in U.S. imports to Canada – targeting beer, bourbon, fruits, clothing and household appliances. Most of these tariffs were scheduled to go into effect on February 4. However, before the tariffs went into effect, Mexico said it would hold off on retaliatory tariffs for one month as it works with the U.S. on border security and drug trafficking. As a result, President Trump delayed U.S. tariffs on Mexico by one month. The U.S. and Canada also announced they would delay their tariff actions against each other by one month as they worked to find solutions to border and trade issues. That said, the tariff rate on China increased by 10% on all imports this month, with Beijing providing measured retaliatory tariffs against U.S. energy exports and farm machinery, while Chinese regulators revived antitrust investigations into some U.S. tech companies. Finally, President Trump continues to threaten additional tariffs that could further threaten global trade stability.
For now, we believe investors and the market as a whole continue to view President Trump's use of tariffs predominantly as a tool to drive American interests (e.g., border security/drug trafficking and better trade deals). And while market volatility has risen since December, stocks have weathered temporary downdrafts reasonably well due to investors' ability to look past the tariff uncertainty and focus on still solid U.S. growth trends, which remain supportive of asset prices, in our view.
Nevertheless, we believe the overall market could see steeper declines if the proposed tariffs are enacted in full and if they are levied over a prolonged period. Markets assume today that even if U.S. tariffs and retaliatory responses from other countries were put in place, they would be in place for just weeks or months until U.S. demands are met.
Yet, tariff actions that escalate due to deteriorating global relationships, become entrenched, create dislocations in supply chains, reduce global efficiencies, increase cost and inflation pressures, or stall growth and corporate profitability are factors not fully priced into the overall market today. If such an environment were to develop, we would expect to see more severe selling pressure across consumer, industrial, material, and technology companies, for example. For a period, this would likely pressure the overall stock market as well and sap investor sentiment.
Will higher interest rates and/or delayed Federal Reserve policy rate cuts start taking a bigger bite out of U.S. growth? Admittedly, the stock market seems to be doing just fine, with a 10-year U.S. Treasury yield hovering around 4.5%, and investors predominantly expecting the next Fed rate cut not to happen until the June or July meeting.
Tack on an Atlanta Fed GDPNOW forecast currently calling for outsized U.S. growth of +2.9% in the first quarter, and S&P 500 earnings estimates pointing to +13% annualized growth in 2025, and the elevated rate environment has currently taken a backseat to Big Tech and tariff concerns. But with core inflation hovering well above the Fed's +2.0% target, U.S. unemployment sitting at just 4.0% in January, and growing investor concerns about the trajectory for U.S. government spending and debt levels, it stands to reason that rates could be stuck in a higher-for-longer environment this year.
Though this is an under-the-surface issue at the moment, a higher rate environment could eventually start stressing smaller companies looking to refinance debt, further slow consumer and business borrowing, and make future corporate profits look less attractive when discounted back to the present (which often uses risk-free rates like the 10-year U.S. Treasury yield).
Bottom line: Rising government bond yields and less room for Fed rate cuts this year added to the stock volatility seen in December and early January. For now, investors appear to be looking past this risk from a day-to-day perspective as yields and Fed expectations have settled into their current state. Nevertheless, macroeconomic developments that send rates higher (e.g., tariffs, sticky inflation, stronger growth, increased fiscal deficits) or further delay Fed easing could quickly see stock volatility rise.
Our guidance: Investors may be better served by not reacting to the news cycle. Stand still and let tariff, Big Tech, and interest rate developments play out over the near term. There's a pause, for now, on major tariffs in North America. Recent updates confirm Big Tech's profitability remains strong. And the U.S. economy appears to be absorbing the current rate environment fairly well. However, investors should expect headlines to stay fluid on these subjects and, in some cases, undetermined. Making investment decisions on still unknown outcomes increases the risk of being wrong or offside if developments shift in the opposite direction.
The week ahead:
Along with key inflation reports, updates on retail sales and Fed Chair Powell’s semiannual update to Congress should grab headlines this week.
- On Wednesday, the core Consumer Price Index (CPI) is expected to tick lower to +3.1% year-over-year in January from +3.2% in December. The headline figure is expected to hold steady at +2.9% on an annualized basis. Such readings could increase already elevated odds that the Federal Reserve will keep its policy rate steady at its March meeting.
- Powell will provide monetary policy updates/testimony to Congress on Tuesday and Wednesday.
- Weather impacts could weigh on January retail sales (Friday).
- During the week, 78 S&P 500 companies are scheduled to report profit results for the previous quarter.