Is the market starting to discount election results?
ANTHONY SAGLIMBENE – CHIEF MARKET STRATEGIST, AMERIPRISE FINANCIAL
WEEKLY MARKET PERSPECTIVES — October 21, 2024

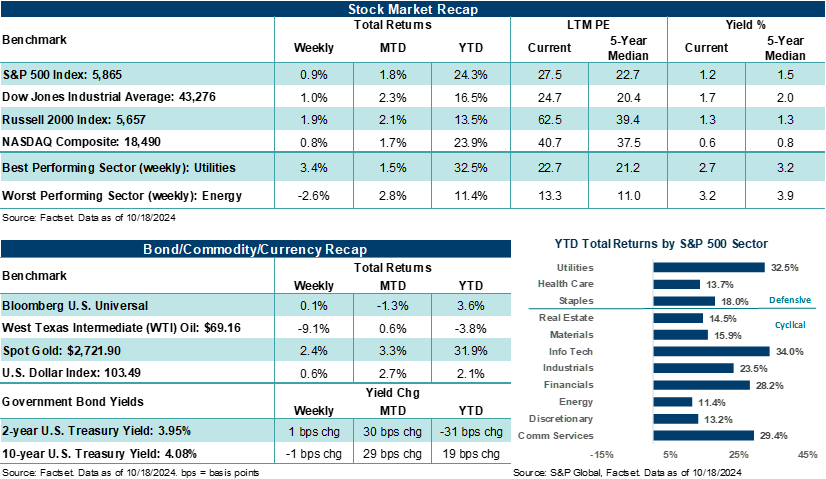
The S&P 500 Index kicked off the third year of its bull market run last week by notching its sixth straight week of gains, the longest winning streak of the year, and climbing to its 47th all-time high in 2024. The Index is higher in nine of the last ten weeks and is up over +24% this year, after gaining more than +26% in 2023. In fact, the S&P 500 is seeing its best year since 1997. Evidence of continued strength across the U.S. economy, solid earnings reports from Financials, and investors beginning to possibly discount a potential Republican victory in November had stocks climbing higher last week. However, on the election point, and as one might suspect, the story is far more complicated and muddier.
Last week in review:
- The S&P 500 rose +0.9% and finished at a fresh all-time high on Friday. By the end of the week, the broad-based U.S. stock benchmark was flirting with our year-end favorable target of 5,900. While stocks are trading at pretty lofty valuations based on this year's earnings expectations, based on next year's profit estimates and other valuation metrics, such as free cash flow, current stock levels don't appear as stretched, in our view.
- At an S&P 500 sector level, Utilities (+3.4%), Real Estate (+3.0%), and Financials (2.4%) led markets higher, adding further momentum behind the market's broadening rally outside of Technology. Notably, Utilities and Financials now have similar year-to-date gains compared to Technology and Communication Services, which was far from the case in the first half of the year.
- The NASDAQ Composite rose +0.8%, with Apple (+3.3%) and NVIDIA (+2.4%) posting solid gains.
- The Russell 2000 Index rose +1.9% and led major U.S. equity averages higher last week. The small-cap barometer is up roughly +40% from its October 2023 low.
- The Dow Jones Industrials Average gained +1.0%.
- Strong third quarter earnings reports from key money-center banks and large financial institutions helped confirm that consumers and businesses remain on firm ground. Credit trends remain solid, trading activity was strong in the last quarter, profitability exceeded estimates in most cases, and sentiment around capital markets activity is on an upswing.
- September retail sales showed its strongest reading since June, with solid month-over-month and year-over-year gains, including positive sales trends across miscellaneous store retailers, clothing stores, health/personal care, and food/drinking establishments. Combined with weekly initial jobless claims coming in lower than expected (and remaining in a stable state), the soft-landing/no-landing narrative continued to gain steam.
- U.S. Treasury prices were largely unchanged, the U.S. Dollar Index notched its third consecutive weekly gain, Gold ended at a new record (above $2,700/oz), and West Texas Intermediate (WTI) crude fell 9.1% for its worst week since March 2023. Quieter Middle East headlines were largely behind the move, though that could change quickly.
- Finally, the European Central Bank (ECB) cut its policy rate by 25 basis points — the first back-to-back cut in thirteen years and the third cut in the current easing cycle.
“We believe investors should continue to count on a 'too-close-to-call' election result at the top of the ticket and divided government post-election. Results outside of this base case may cause some near-term market volatility as traders/investors attempt to discount what the results may mean for taxes, tariffs, sector opportunities/risks, and regulation. That said, fundamental conditions in the U.S. remain solid, and we believe a well-diversified portfolio should help investors weather the outcomes that develop once election results are known.”
Anthony Saglimbene - Chief Market Strategist, Ameriprise Financial
Is the market starting to discount election results? And by the way, America wants its commercials back.
With fifteen days to go before election day and early/absentee voting underway across all fifty states, November 5th can't come soon enough. For those of us living in key battleground states, we suspect many are pining for the return of our frequent/comfortable/light-hearted beer, gambling, and pharmaceutical commercials to FINALLY stop the pain of constant political bombardment when we watch television. We would venture to say the endless cycle of end-of-the-world messaging from Democrats and Republicans in a continuous loop has largely exhausted Americans living in key swing states at this point. $10.2 billion will have been spent across all advertising platforms for all political races once the 2024 U.S. election is complete, according to a forecast from AdImpact, an analytics firm that tracks political advertising. That would mark a +13% increase from the $9.02 billion spent on political advertisements over the 2020 election. Much of this spending has been concentrated across just seven states (Pennsylvania, Michigan, Wisconsin, Georgia, North Carolina, Arizona, and Nevada). Coors, Modelo, Wegovy, MGM, and FanDuel, please take us away!
Importantly, election polls continue to show a tight presidential race, particularly in battleground states. However, betting markets have recently broken in favor of a presidential win for former President Trump over Vice President Harris. PredictIt odds (a prediction market that allows individuals to place real money bets on election outcomes) have steadily risen for a Trump victory on November 5th since around mid-September. Other prediction markets, including Polymarket and Kalshi, have seen a similar trend toward increasingly favoring a Trump victory.
That said, prediction markets are small relative to the general U.S. electorate and also include international participants. Notably, election polling and prediction markets are far from perfect forecasters, and each presents flaws that can influence or skew the data. At times, these prediction tools simply get the results wrong. Betting markets also tend to skew male, who, based on several polls, tend to favor Trump over Harris. However, at least from a market perspective, the prediction markets have seen a ramp higher in real money bets on a potential Trump victory as the election draws closer, which is worth taking note of as an investor. Given the wide audience of participants, diverse opinions, decentralized approach, and ability to reward participants monetarily for correctly predicting an outcome, we believe investors would be unwise to ignore this election information. Further, Financials, Energy, and U.S. small-cap stocks have all seen improved performance this month based on growing odds of stable economic/profit conditions heading into next year. Yet, some of that momentum may also signal investors' increasing confidence in a Republican election victory next month that may pave the way for lower taxes and less regulation.
We would be remiss if we didn't mention another market indicator that could favor a White House victory for VP Harris and which counters what the prediction markets may be telling us about the election currently. A longstanding rule of thumb in the market suggests that if stocks are up in the weeks and months before election day, the incumbent party usually wins the White House. Under this view, the S&P 500 correctly predicted the outcome of the last 20 of 24 presidential elections when the Index was higher three months prior to election day, according to Leuthold Group. And under a similar methodology, using the Dow Jones Industrials Average, Leuthold found the Dow correctly predicted the last 22 of 24 presidential election winners. It only missed Dwight Eisenhower's 1956 reelection and Richard Nixon's 1968 victory over Hubert Humphrey. Since August 5th, the S&P 500 is higher by over +13.0%, while the Dow is up nearly +12.0 %.
Bottom line: We believe investors should continue to count on a 'too-close-to-call' election result at the top of the ticket and divided government post-election. Results outside of this base case may cause some near-term market volatility as traders/investors attempt to discount what the results may mean for taxes, tariffs, sector opportunities/risks, and regulation. That said, fundamental conditions in the U.S. remain solid, and we believe a well-diversified portfolio should help investors weather the outcomes that develop once election results are known.
The week ahead:
The third quarter earnings season ramps higher this week, while investors will receive fresh looks at home data and preliminary manufacturing/services activity for October.
- During the week, 112 S&P 500 companies, including 7 Dow 30 components, are scheduled to report third quarter results. With roughly 14% of S&P 500 third quarter reports complete, 79% of companies have reported earnings per share results above analyst estimates, which is higher than the 77% five-year average, according to FactSet.
- September leading indicators, existing home sales, and building permits will help add color to the macroeconomic picture. Fresh looks at S&P Global manufacturing and services PMI for October will help add context around current economic activity as well as the environment for labor conditions.