 Return to My Accounts
2024 midyear market pulse check
Anthony Saglimbene, Chief Market Strategist – Ameriprise Financial
July 15, 2024


Outside of a brief drawdown in April, the general momentum for stocks was higher through much of the second quarter. As a result, by the end of June, stock volatility had reached some of its lowest levels going back to January 2020.
But will this period of relatively uninterrupted growth last? Here’s our midyear review and outlook for the second half of 2024:
A look back at the first half
From a quarterly perspective, the S&P 500 Index closed out its third consecutive quarter of gains, finishing higher by +4.3% in the second quarter. Over the last three quarters, the Index is higher by over +27% through the end of June, seeing its strongest three-quarter run since the second quarter of 2021. Notably, the S&P 500 has been higher in six of the last seven quarters as pandemic and inflation-related pressures have eased.
Importantly, major U.S. stock averages finished the first half of the year broadly higher. The S&P 500 rose +15.3% in the first six months of the year and the NASDAQ Composite rose +18.6%.
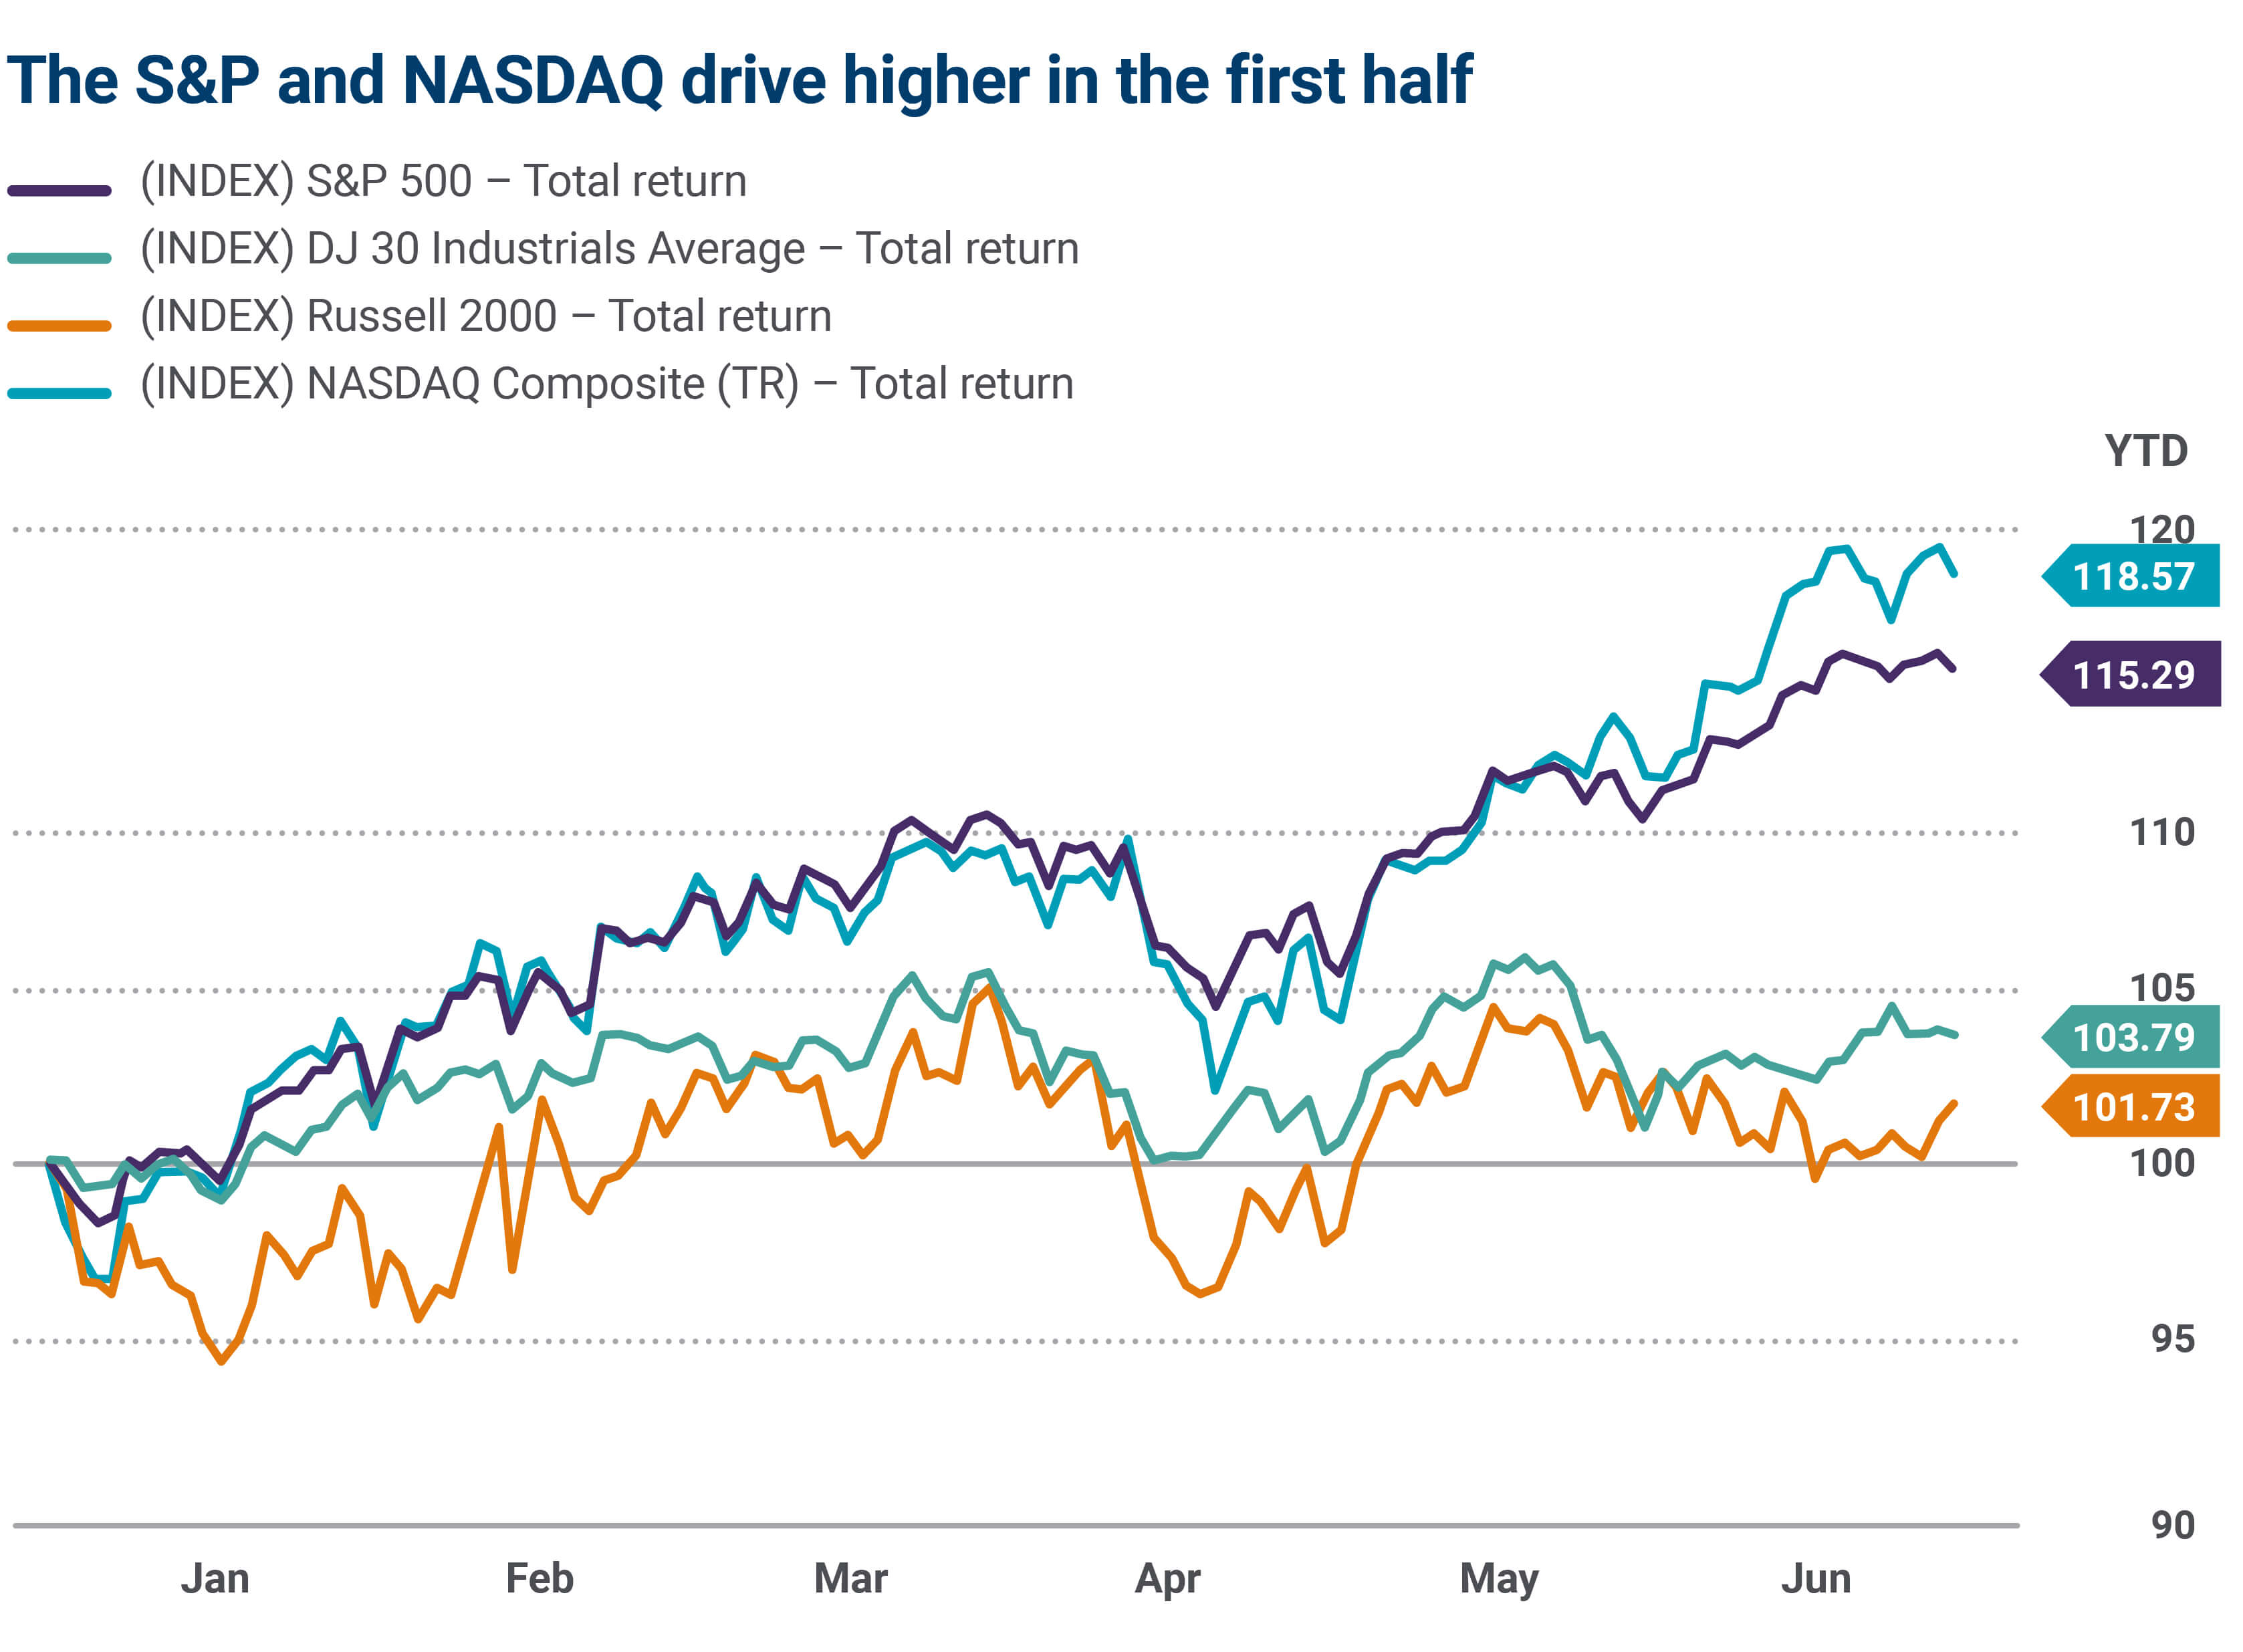
Source: FactSet. Data as of 6/30/24.These figures are shown for illustrative purposes only and are not guaranteed. Past performance is not a guarantee of future results. Investors cannot invest directly in an Index.
An artificial intelligence boom helped drive a select group of Technology stocks higher in the first half, leading to +25% plus gains across Information Technology and Communication Services. Equity returns, at least for the S&P 500 and NASDAQ, rivaled first half returns seen in the late 1990s.
Yet nearly 60% of the S&P 500’s return in the first six months of the year can be attributed to just five mega-cap stocks (i.e., NVIDIA, Microsoft, Meta Platforms, Amazon and Apple). In fact, that concentration of leading stocks narrowed over the second quarter, with just three companies, NVIDIA, Apple and Microsoft, driving 90% of the S&P 500’s return in Q2.
Nevertheless, ten of eleven S&P 500 sectors finished the first half with gains, though returns were more muted compared to the broader S&P 500. In addition, the Dow Jones Industrials Average (+3.8%) and Russell 2000 Index (+1.7%) trailed the S&P 500 significantly in the first half, weighed down by mixed economic/consumer trends and elevated interest rates.
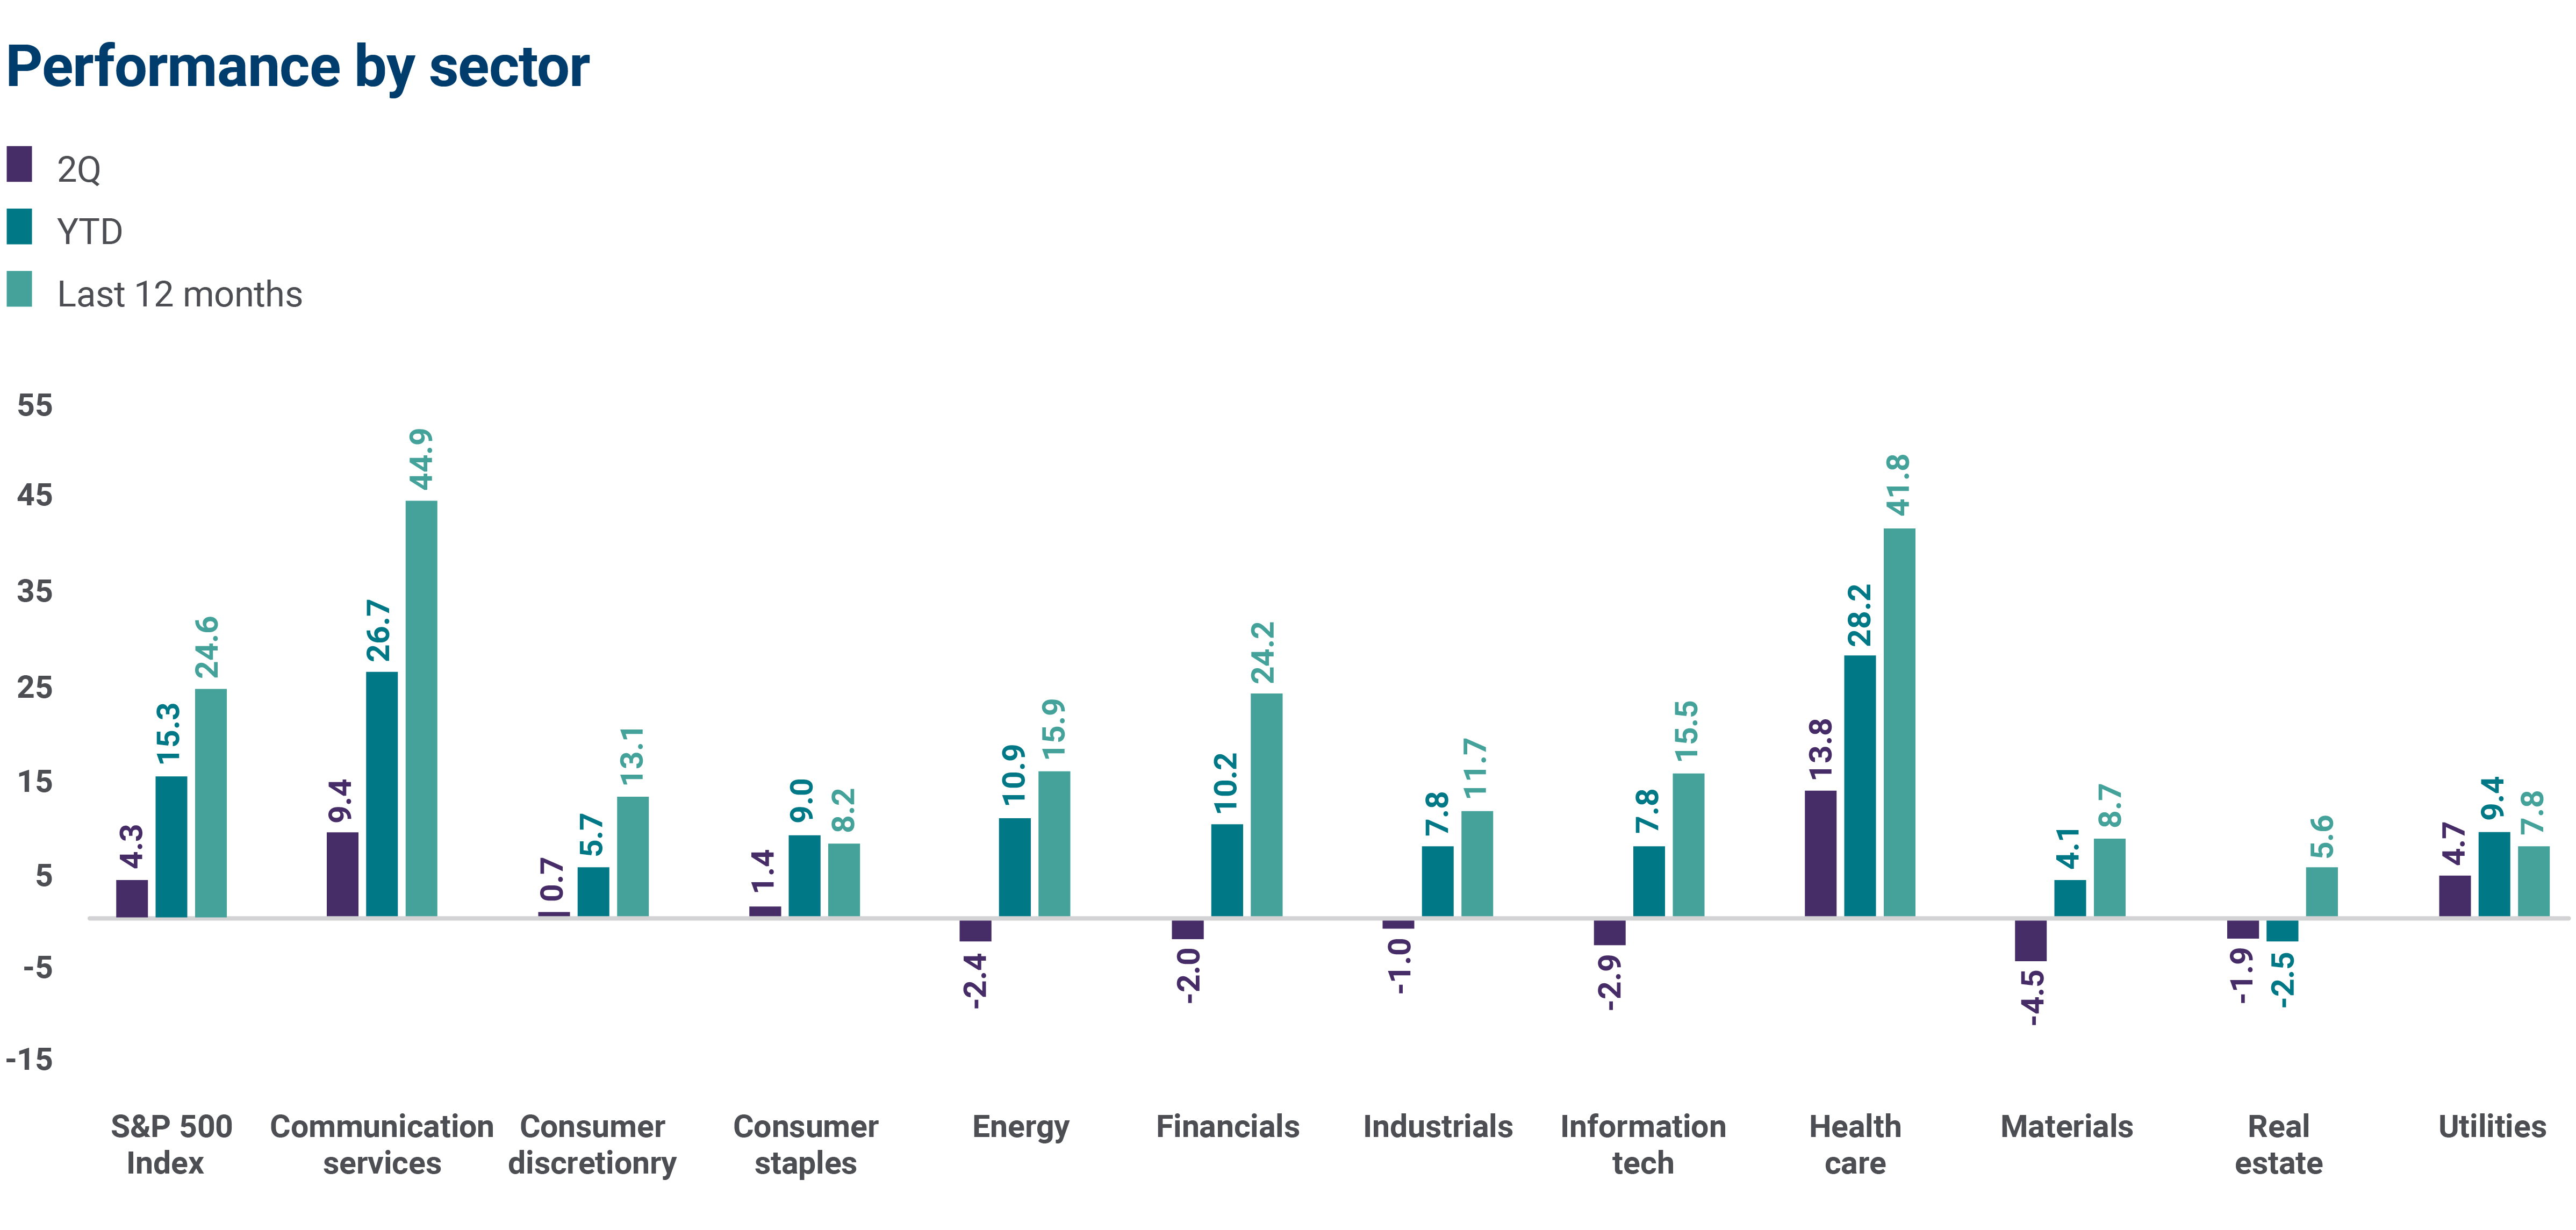
Source: Bloomberg. Data as of 6/30/24.These figures are shown for illustrative purposes only and are not guaranteed. Past performance is not a guarantee of future results. Investors cannot invest directly in an Index.
Notably, outside of clear/visible/secular profit trends across a handful of companies, elevated interest rates, lingering services inflation, slowing growth concerns and a Federal Reserve on pause kept a lid on how high the rest of the market was able to rise in the first half given current valuation levels. For instance, the S&P 500’s trailing price-to-earnings ratio ended the second quarter 44% above its 20-year average, mostly driven by mega-cap Technology stocks.
In fixed income, the 10-year U.S. Treasury yield increased 48 basis points in the first half to finish at 4.37%. Return performance across major bond indexes was mixed. Falling expectations for the number of Federal Reserve rate cuts this year and growing concerns about U.S. debt/deficit spending kept fixed income volatility elevated.
On the economic front, U.S. growth slowed but remained positive, core consumer inflation (ex-food and energy) fell to its lowest levels since May 2021 (through June), and the labor market stood on a solid foundation. Overall, normalizing economic activity kept the Federal Reserve comfortable leaving its Fed funds rate at 5.25% to 5.50% in the first half — a 20-plus-year high.
A look ahead at the second half
As the second half of the year gets started, below are some key points to keep in mind:
- The path higher for stocks may not be so smooth in the months ahead. Concentrated stock returns, low volatility and minimal trading volume could leave the door open to increasing risk for stock prices should the soft-landing narrative see some unexpected turbulence through year-end.
- Potential adverse economic conditions pose a risk for stocks. Market participants have largely priced in scenarios that see the U.S. economy growing in the second half, profit growth improving, inflation moderating lower and interest rates ebbing lower. Scenarios that challenge this view could see stock prices grapple with increased volatility.
- Fundamental conditions remain on firm footing, in our view. Should economic and profit growth continue to stay positive in the second half, we see a path higher for U.S. major stock averages, possibly including broader participation, which was lacking in the first half of the year.
- Inflation should continue to moderate lower in the second half, allowing the opportunity for the Federal Reserve to begin easing monetary policy later this year. Investors should have a strategy to lock in higher rates within their fixed income allocations.
- A broadening of the stock rally is possible. While S&P 500 earnings growth in the first quarter was largely concentrated across a handful of mega-cap technology companies, an increasing number of companies and industries are expected to see positive profit growth through year-end. If profit estimates for 2024 are achieved or surpassed, we believe major U.S. stock averages could continue to grind higher.
- Stocks can see drawdown periods of 10% or more during the year for any number of reasons, including U.S. election-related volatility. However, if fundamental conditions remain on track, investors may want to consider stock pullbacks to reallocate excess cash or as a catalyst to reposition portfolios back to target allocations.
- The market currently expects a divided government following the November U.S. election. Increasing odds in the second half or results that lead to one-party control in Washington could see added stock market volatility for a period as investors reassess fiscal spending priorities and the potential impacts on interest rates and inflation. However, well-diversified portfolios and a focus on high-quality investments can help investors navigate through a brief period of potential election-related volatility.
Reach out to your Ameriprise financial advisor
As conditions evolve in the second half, your Ameriprise financial advisor can provide our latest thinking on the markets and economy, as well as personalized guidance on the trends shaping your investments.