Despite how it feels, the market has been here several times before
ANTHONY SAGLIMBENE – CHIEF MARKET STRATEGIST, AMERIPRISE FINANCIAL
WEEKLY MARKET PERSPECTIVES — March 17, 2025

Major U.S. stock averages were again under pressure last week. The S&P 500 Index and NASDAQ Composite fell for the fourth straight week despite inflation reports that showed a deceleration in price pressures last month. Fast-moving tariff headlines and actions that drew continued concern about the growth environment, as well as a further deterioration in consumer confidence, kept stocks on the defensive most of the week while gold prices hit a new high.
This week, the Federal Reserve will enter the spotlight. Given a still murky inflation environment and growing concerns regarding White House policies on the near-to-intermediate term trajectory for growth, the Fed’s policy statement and quarterly Summary of Economic Projections on Wednesday will likely have an outsized influence on directing stock traffic as the week comes to a close.
Last week in review:
-
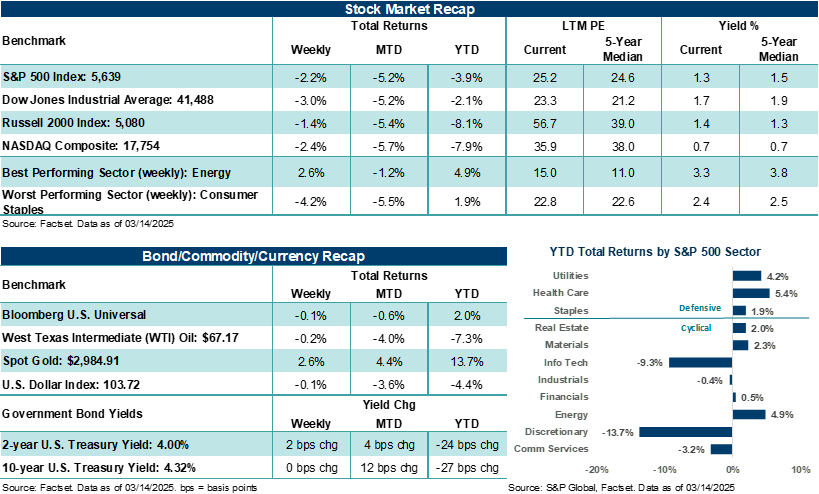
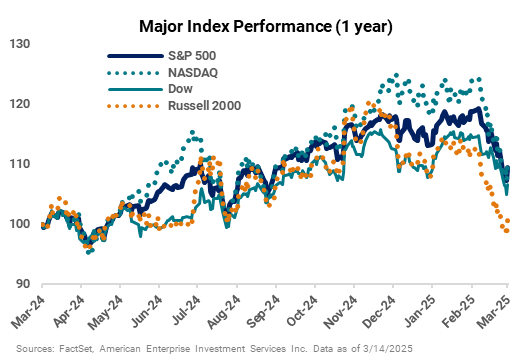
The S&P 500 dropped 2.2%. Over the last four weeks, the broad-based U.S. stock barometer is down 7.8% — its worst point decline stretch since the week ending April 3, 2020, and its worst percentage decline since the week ending October 7, 2022.
-
The NASDAQ Composite fell 2.4% and is down 11.4% over the last four weeks. The four-week stretch is the Composite’s worst performance since March 20, 2020, on a point basis and its worst performance since October 7, 2022, on a percentage basis.
“The on-again, off-again tariff headlines over recent weeks, growing uncertainty about the growth environment, and a couple of years of significant gains across stocks have compelled some investors to take a sell first, ask questions later approach and wait out the drama from the sidelines.”
Anthony Saglimbene - Chief Market Strategist, Ameriprise Financial
- The Dow Jones Industrials Average lost 3.0%, ending its worst week in roughly two years. The Russell 2000 Index dropped 1.4%, as the small-cap barometer finished the week roughly 17% below its late November highs.
- U.S. Treasury prices were mostly firmer across the curve, the U.S. Dollar Index ended basically flat, and Gold crossed $3,000 per ounce for the first time before settling slightly lower. Notably, Gold is higher by almost +14.0% this year and is one of the few assets providing a consistently defensive posture during this recent spate of market volatility.
- West Texas Intermediate (WTI) crude logged its eighth straight week of declines, which is its worst losing streak since 2015. Concerns about a global growth slowdown and OPEC+ supply issues are weighing on crude prices.
- The February Consumer Price Index (CPI) and Producer Price Index (PPI) came in cooler than expected. Headline and core (ex-food and energy) consumer inflation readings saw modest downticks last month from January levels, while producer prices saw a more meaningful drop. That said, February core CPI stood at +3.1% year-over-year, while core PPI finished last month at +3.4%, still well above the Fed’s +2.0% inflation target.
- A preliminary look at March University of Michigan Consumer Sentiment came in well below expectations and February levels — posting its worst reading since November 2022 (or shortly after the bottom of the last bear market). Although the survey has a fairly large political bias, tariff uncertainty, growth fears, and deteriorating confidence in one’s personal financial situation are currently weighing on consumer attitudes. Importantly, consumer inflation expectations over the next year and five years rose, a development that is unlikely to sit well with the Federal Reserve as it meets this week.
- Finally, from Washington, President Trump put 25% tariffs on aluminum and steel, prompting Canada and the European Union to retaliate, which prompted Trump to impose 200% tariffs on EU alcohol. Market participants continued to try to make sense of the White House tariff strategy, with reciprocal tariff announcements expected on April 2. In a positive development, Congress passed a continuing resolution that funds the U.S. government through September 30.
Despite how it feels, we’ve been here several times before.
There is no doubt that it’s been a difficult few weeks for investors. Late last week, one of the broadest measures of the U.S. stock market, the S&P 500 Index, briefly dipped down 10% from its all-time high made less than a month ago. The S&P 500 has now shed over $5.0 trillion since its February 19 high. That’s in addition to severe selling pressure across the NASDAQ Composite and Russell 2000 Index over recent weeks. Each is firmly in correction territory and is looking to avoid “bear” market declines (i.e., a 20% or more drop from their recent highs). Simply put, investors are finding it extremely difficult to keep up with all the fast-moving tariff headlines out of Washington and, most importantly, what these threats and actions mean for growth and profits over the coming quarters. Notably, consumer and investor sentiment has deteriorated rapidly as a result, with an increasing number of Americans seeing a more difficult environment ahead for the U.S. without a more articulate message from the White House on tariff policy. Bottom line: The on-again, off-again tariff headlines over recent weeks, growing uncertainty about the growth environment, and a couple of years of significant gains across stocks have compelled some investors to take a sell first, ask questions later approach and wait out the drama from the sidelines.
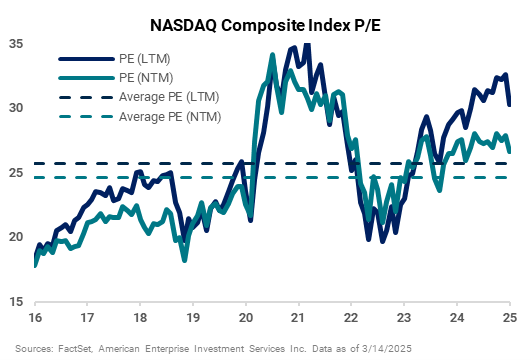
That said, price-to-earnings valuations across the market have fallen meaningfully as a result of the recent selling pressure. Although indexes such as the NASDAQ Composite still sport elevated multiples relative to their longer-term history, their relatively strong expected earnings growth for this year (if achieved) combined with lower P/Es, at some point, may begin to entice longer-term investors to put their shopping lists together.
Additionally, the number of S&P 500 stocks trading below their longer-term 200-day moving average has soared higher over recent weeks and is approaching rare levels based on history. Usually, when 70% or more of S&P 500 stocks are trading below their 200-day moving average, the market is grappling with extreme uncertainty. On Thursday, the level touched 67%. The Fed rate hiking cycle (2023), elevated inflation (2022), COVID-19 (2020), Fed rate hiking cycle (2018), Chinese yuan devaluation (2015), U.S. debt downgrade/European double-dip recession (2011), and the Financial Crisis (2007-2009) are some recent examples where the number of S&P 500 stocks trading below their 200-day approached 70% or above. In some cases, the number of stocks trading below their longer-term trend line rose much higher than 70%, stocks experienced additional declines, and a bear market formed. In other cases, where conditions stabilized, and a recession didn’t form, the number of stocks reclaiming their 200-day moving average rose, and the market stress provided an opportunity to invest. In all cases, where investors had enough time to weather the volatility, stocks went on to recover from the selling pressure wherever the bottom formed for that period of uncertainty.
Importantly, since 1990, the S&P 500 Index has experienced, on average, an intra-year drawdown of 14.2%, with more than half those occurrences seeing the Index avoid a bear market. Bottom line: The last few weeks have felt rough, and uncertainty is running high. However, the market has been here many times before, and the events shaping today’s uncertainty (tariffs and growth concerns) appear in good company with all the other unknowns of the time that shaped stock and investor reactions back then. In our view, continue to lean on well-diversified investment strategies, know what you own, and avoid making emotional decisions if the market stress elevates from here. These simple strategies can help you through to the other side and help you navigate until more clarity forms.
These examples are shown for illustrative purposes only and are not guaranteed. It is not possible to invest directly in an index. Past performance is not a guarantee of future results.
The week ahead:
Retail sales, the Federal Reserve, and home data are all on tap this week.
-
The February retail sales report is out on Monday. Investors will be looking for clues on how weak consumer sentiment data is translating into consumer spending trends. As we’ve noted here before, the top 10% of households by income category currently account for half of all consumer spending in the U.S. Given recent market volatility and an earnings warning out of Delta Airlines last week, trends across higher income earners could come under more scrutiny.
- The Federal Reserve is widely expected to hold its policy rate unchanged at 4.25% - 4.50% on Wednesday for the second meeting in a row. However, the Fed’s messaging will be critical, as markets are on edge. Any language or statements that indicate officials are not in tune with current growth concerns could cause equity pressure to accelerate. That said, inflation remains above its target, which complicates its messaging strategy. Updated economic projections and Fed Chair Powell’s press conference will offer ample opportunities above and beyond the policy statement for the Fed to provide needed detail.