Return to My Accounts
A look at what drove markets in the first half of the year
ANTHONY SAGLIMBENE – CHIEF MARKET STRATEGIST, AMERIPRISE FINANCIAL
WEEKLY MARKET PERSPECTIVES — July 2, 2024

The S&P 500 Index (+3.6%) and NASDAQ Composite (+6.0%) closed June higher for the second straight month, notching their fifth monthly gain for 2024. Solid June gains in NVIDIA (+12.6%) and Apple (+9.6%) helped drive both indexes higher in the final month of the first half of the year. In the middle of June, NVIDIA surpassed Microsoft as the most valuable company on the planet. However, shares of the artificial intelligence chip maker quickly slumped by over 15% amid concerns its valuation had become stretched and the trade had become too crowded. Yet, by the end of the month, shares had recovered some of the lost ground as investors used the opportunity to buy shares.
Importantly, the general momentum for stocks was higher in June and through much of the second quarter. As a result, by the end of the month, stock volatility had reached some of its lowest levels going back to January 2020. From a quarterly perspective, the S&P 500 closed out its third consecutive quarter of gains, finishing higher by +4.3% in Q2. Over the last three quarters, the Index is higher by over +27%, seeing its strongest three-quarter run since the second quarter of 2021. Notably, the S&P 500 is higher in six of the last seven quarters.
“Should economic and profit growth continue to stay positive in the second half, we see a path higher for U.S. major stock averages, possibly including broader participation, which was lacking in the first half of the year.”
Anthony Saglimbene - Chief Market Strategist, Ameriprise Financial
As the second half of the year begins, concentrated stock returns, low volatility, and minimal trading volume leave the door open to increasing risk for stock prices should the soft-landing narrative see some unexpected turbulence through year-end. That said, fundamental conditions remain on firm footing, in our view. Should economic and profit growth continue to stay positive in the second half, we see a path higher for U.S. major stock averages, possibly including broader participation, which was lacking in the first half of the year.
Last week in review
- The S&P 500 ended at 5,460 after briefly touching 5,523 on Friday and hitting a new all-time intraday high.
- The core Personal Consumption Expenditures Price Index (the Federal Reserve’s preferred inflation measure) fell in May to its lowest level since March 2021. Several more months of cooling PCE prints will likely be needed to keep a September Federal Reserve rate cut on the table.
- May personal spending growth came in a bit weaker than expected, while personal income was a tad higher than forecast.
- June Consumer Confidence came in largely as expected, with one-year ahead inflation expectations ticking down slightly.
- President Biden’s poor debate performance on Thursday increased uncertainty about his ability to perform the rigorous duties of the U.S. Presidency over the next four years.
The first half in review
Despite a narrowing rally in the second quarter, major U.S. stock averages finished the first half of the year broadly higher. Equity returns, at least for the S&P 500 Index and NASDAQ Composite, rivaled first half returns seen in the late 1990s. Yet nearly 60% of the S&P 500’s return in the first six months of the year can be attributed to just five mega-cap stocks (i.e., NVIDIA, Microsoft, Meta Platforms, Amazon, and Apple). In fact, that concentration of leading stocks has narrowed over recent months, with NVIDIA, Apple, and Microsoft driving 90% of the S&P 500’s return in the second quarter.
Outside of clear, visible, and secular profit trends across a handful of companies, elevated interest rates, lingering services inflation, slowing growth concerns, and a Federal Reserve on pause have kept a lid on how high the rest of the market has been able to rise given current valuation levels. For instance, the S&P 500’s trailing price-to-earnings ratio ended the second quarter 44% above its 20-year average, mostly driven by mega-cap Technology stocks.
Below is a bulleted view of the key market and economic factors that have driven markets so far this year:
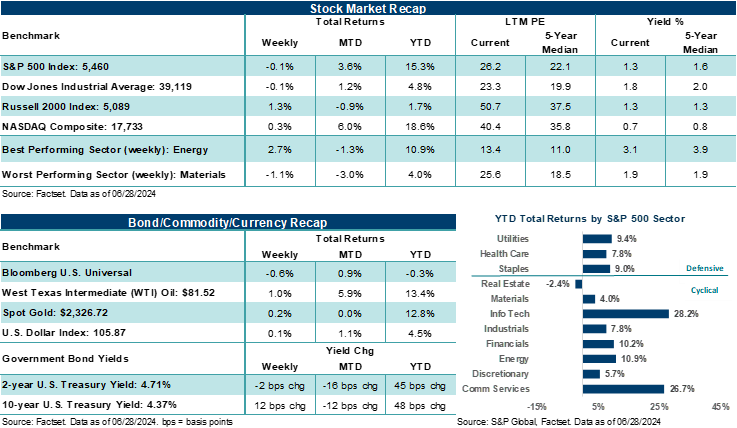
- The S&P 500 Index rose +15.3% in the first six months of the year, and the NASDAQ Composite rose +18.6%. An artificial intelligence boom helped drive a select group of Technology stocks higher in the first half, leading to +25% plus gains across Information Technology and Communication Services. Nevertheless, ten of eleven S&P 500 sectors finished the first half with gains. Real Estate was the sole S&P 500 sector to finish lower.
- The Dow Jones Industrials Average (+4.8%) and Russell 2000 Index (+1.7%) trailed significantly, as mixed economic and consumer trends and elevated interest rates weighed on sentiment.
- The 10-year U.S. Treasury yield increased 48 basis points in the first half to finish at 4.37%. Performance across major bond indexes was mixed. Falling expectations for the number of Federal Reserve rate cuts this year, and growing concerns about U.S. debt and deficit spending kept fixed income volatility elevated.
- In the first quarter, the U.S. economy grew by +1.4%. The Atlanta Federal Reserve GDPNOW forecast suggests the domestic economy grew by +2.2% in the second quarter. The longer-term U.S. growth average is around +2.0%.
- Consumer spending (roughly 70% of the U.S. economy) was resilient throughout the first half. However, lower-income consumers continue to struggle under inflation pressures, while mid-to-higher-end consumers have become more discerning about how and where they spend.
- The U.S. unemployment rate stood at 4.0% at the end of May, up from 3.7% at the end of December.
- The headline Consumer Price Index (CPI) flatlined on an annualized basis over the first five months of the year, ending May at +3.3%. Nevertheless, core CPI (ex-food and energy) dropped from an annualized level of +3.9% at the end of December to +3.4% by the end of May. Notably, May core CPI stood at its lowest level since August 2021. And when shelter is excluded, CPI stood at +1.9% in May, its lowest level since May 2021. Bottom line: Inflation across a host of measures showed slow but steady progress lower in the first half.
- S&P 500 earnings per share (EPS) grew by nearly +6.0% year-over-year in the first quarter, almost double what analysts projected at the end of March. In the second quarter, S&P 500 EPS is expected to grow by over +8.0% year-over-year. While earnings growth in the first quarter was largely concentrated across a handful of mega-cap technology companies, an increasing number of companies and industries are expected to see positive profit growth in the second quarter.
- Gold rose nearly +13.0% in the first half, while West Texas Intermediate (WTI) crude jumped almost +14%.
- The U.S. Dollar Index remained strong, with the dollar advancing +4.5% against a basket of developed world currencies.
The week ahead
The second half of the year opens with key looks at manufacturing and services activity as well as an always important nonfarm payrolls report for June. Trading volume should be rather light this week as markets will be closed on Thursday for the Independence Day holiday.
- June ISM manufacturing activity is expected to improve over May’s level but remain in contraction. In addition, ISM services activity likely remained in expansion last month but slowed versus May.
- Friday’s June nonfarm payrolls report is expected to show job gains of +180,000 and an unemployment rate of 4.0%.
Updates on June construction spending, final reads on June PMI, a May JOLTS report, and FOMC minutes from the last Federal Reserve meeting line the shortened holiday calendar.