What interest rate cuts may mean for investors
Brian Erickson, Fixed Income Strategist – Ameriprise Financial
Oct. 14, 2024

Interest rate cuts are finally here. After sitting on hold for 13 months, the Federal Reserve cut its key policy rate by 0.50% at its September meeting, turning away from its highly restrictive policy stance aimed at slowing economic activity.
The pivot formalizes a change in direction for the Fed, which now seeks to normalize monetary policy and make it easier again for companies and consumers to borrow. Here’s what this change in course means for investors, consumers and corporations.
What lower rates mean for investors
What impact may lower interest rates have on the major asset classes? Here’s our view:
- Fixed income impact: More rate cuts are likely on the horizon and fixed income markets have already adjusted to where policy may be headed next. Bond prices surged higher in August and again in September, anticipating the Fed’s move and that once the Fed started lowering its policy rate, a protracted string of cuts could follow. In bond markets, prices rise as yields fall. So, with policy rates and bond yields moving lower, fixed income performance shined through. Since the end of June, the Bloomberg US Aggregate Bond Index outperformed the S&P 500 Index until the final days of the third quarter. Surging bond prices, which led bond yields lower, boosted total returns.
- Equity impact: With Fed cuts underway and more likely ahead in the fourth quarter, stocks rallied in the final days of the third quarter to edge out high-quality bonds. We believe further Fed rate cuts may enable the U.S. economy to slow over time, achieving a soft landing (i.e., a scenario where the economy avoids a recession). This may support equity investments and could enable fixed income investors to see favorable total return performance into next year.
- Cash impact: As quickly as floating rate and cash investments became the ones to own in 2022 and 2023, Fed rate cuts are likely to sweep them out of the spotlight in favor of investments that earn fixed-rate yields for more years. For example, investors may turn to short-term high-yield bond funds that hold today’s yields for a few more years, even if the economy experiences a less-than-soft-landing.
What lower rates mean for borrowers
Combined, falling borrowing costs may boost consumer and corporate spending on the margin, serving as a modest tailwind for economic activity.
- Consumer spending: Consumers looking to use future earnings to purchase today may find financing options more reasonable and easier on the budget than earlier this year. This may add some flexibility for those looking to fund purchases with a loan, rather than selling investments. That said, consumers with long term low-cost mortgages may continue to find financing a new home purchase at current mortgage rates much less attractive than staying in their current home.
- Corporate spending: Leveraged companies looking to refinance existing debt may be able to replace maturing debt today. Though the new cost of borrowing may be higher than financing originating in 2021 and 2022, the increase may be easier to absorb today compared to earlier this year. In addition, the bar for financing facility expansion or acquisitions has already moved lower in anticipation of where Fed policy may be headed. Funding new opportunities with adjustable rates likely track Fed policy rates lower well into 2025.
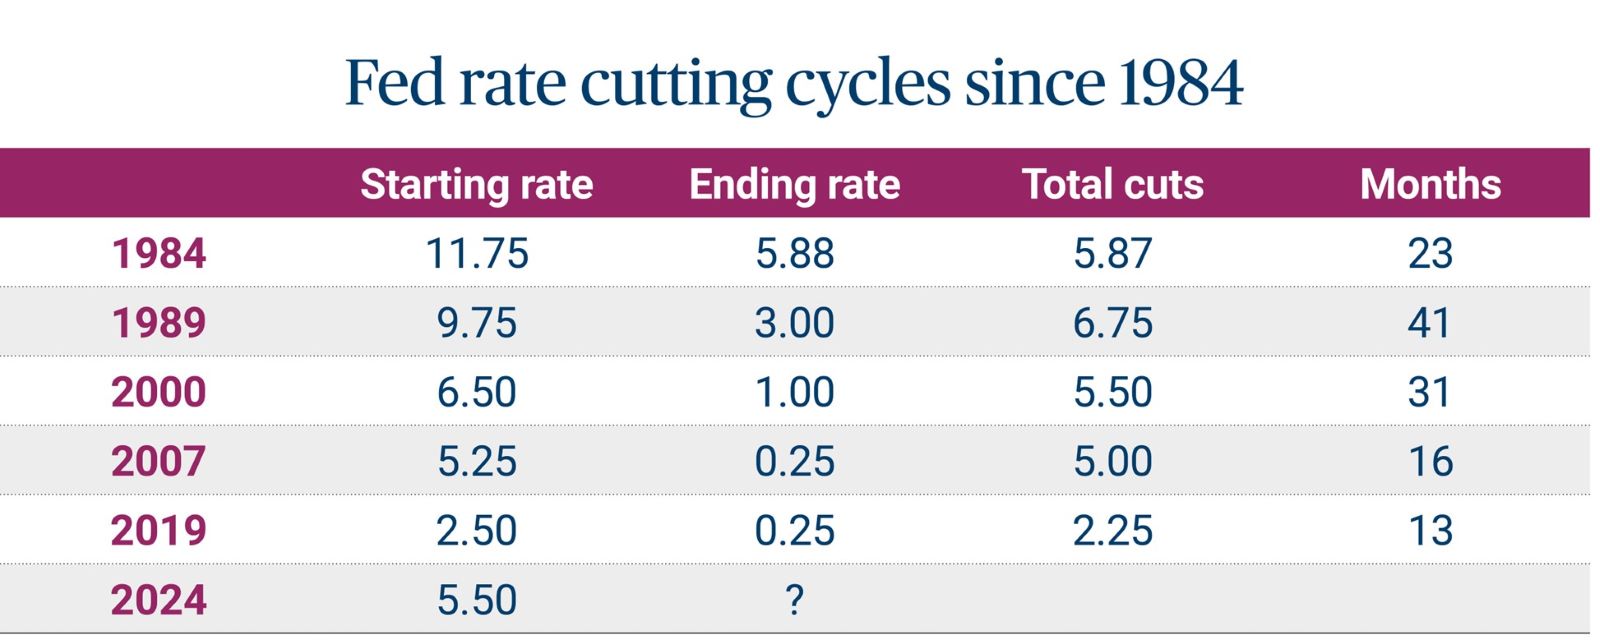
Source: The Federal Reserve
A deeper look at how Fed policy evolved over the past rate reduction cycles may provide some context and clues for today’s environment:
- 2024: At the onset of our current cycle, the top boundary of the Fed’s target range stood at 5.50% before the Fed’s bold step to 5.00%. While raising its policy rate from essentially zero by more than five percentage points through 2022 and 2023, the Fed underwent the most rapid set of increases and the largest amount since 1980. Thus, when the Fed pivoted to rate cuts in September, initially slicing policy rates by half of a percent, it reflected a decisive shift in departing from a highly restrictive policy stance.
- 2019: Cutting policy rates in 2019 began with 25 basis points and reached 75 basis points of rate reductions before the Fed plunged policy rates back to the lower bound of 0.00% to 0.25% with the onset of COVID-19-related business closures.
- 2007: The 2007 rate reduction cycle started at 5.25% and cut rates by five percentage points to effectively zero. The cascade of financial stress points that ultimately led to the Great Financial Crisis unfolded over 16 months, unfolding by incremental quarter-point cuts and at other times by 50, 75 and even 100 basis points as the Fed rushed to get ahead of collapsing activity. The other pattern we might see repeated in this cycle was a larger cut followed by an incremental quarter-point cut or even holding policy steady for several meetings to assess how policy passed through into economic activity.
- 2000: The 2000 rate cycle began at 6.50% and continued for 31 months, ending 5.50% lower than where it started. Leading up to the first rate cut, the Fed held its policy rate steady for just seven months, compared to 13 months in 2024. A mix of 25 and 50 basis point cuts followed an initial 100 basis point cut, lowering the policy rate by 475 basis points to 1.75% over 12 months. After nearly 10 months, the Fed further cut rates and dropped the policy rate to 1.00% over the course of the next eight months. In all, the cutting cycle lasted 31 months and lowered the Fed’s policy rate by 550 basis points. One volatile year after the first rate cut, the S&P 500 Index was down nearly 20%, and 10-year Treasury yields stood eight basis points lower at 5.03%.
- 1989: In 1989, approaching policy from the hawkish side of its policy mandate due to missteps in the 1970s where the Fed mistakenly allowed policy rates to remain elevated, the Fed paused at a peak policy rate of 9.75% for just four months, before pivoting and lowering policy rates by 675 basis points over 41 months. One year into rate cuts, the Fed’s policy rate was just 150 basis points lower, wiping out the final nine months of rate hikes. For markets, 12 months after the Fed’s first rate cut, the S&P 500 Index was up 13%, and 10-year Treasury yields, after initially falling 85 basis points, stood unchanged.
- 1984: Starting with the Fed’s policy rate at 11.75%, the Fed clearly showed the willingness to get on top of inflation when it posed a challenge to the Fed’s price stability mandate. With 587 basis points in cuts over just under two years, the Fed’s pivot also acknowledged that policy rates in that context had been highly restrictive and should be used for only a short period. We see limited applicability to our current context given 1970s inflation and the Fed’s bold effort to break inflation between 1979 and 1982 that led to the 1984 rate-cutting cycle.
What the Fed may do next
Over the past two and a half years, the Fed aimed to slow inflation by raising policy rates. Today, the Fed views the risks of inflation as balanced with the risks of high unemployment. So where may Fed policy be headed next year?
As long as inflation pressures remain at bay and labor markets are healthy, the Fed will likely lead policy rates to around 3%, in our view. Moderating inflation and balanced labor markets — between the supply of workers and companies’ needs for employees — point to a soft landing ahead. Should layoffs pick up, unemployment rise meaningfully or inflation once again become unanchored, the Fed may need to change its destination. But, in our view, the economy is on track so far.
Get personalized guidance from your financial advisor
As the monetary policy environment evolves, connect with your Ameriprise financial advisor on potential investment opportunities that could benefit you. They can provide context on how the current interest rate environment may affect your portfolio and recommend adjustments that may help better optimize your performance
The views expressed are as of the date given, may change as market or other conditions change, and may differ from views expressed by other Ameriprise Financial associates or affiliates. Actual investments or investment decisions made by Ameriprise Financial and its affiliates, whether for its own account or on behalf of clients, will not necessarily reflect the views expressed. This information is not intended to provide investment advice and does not account for individual investor circumstances.
Some of the opinions, conclusions and forward-looking statements are based on an analysis of information compiled from third-party sources. This information has been obtained from sources believed to be reliable, but accuracy and completeness cannot be guaranteed by Ameriprise Financial. It is given for informational purposes only and is not a solicitation to buy or sell the securities mentioned. The information is not intended to be used as the sole basis for investment decisions, nor should it be construed as advice designed to meet the specific needs of an individual investor.
There are risks associated with fixed-income investments, including credit risk, interest rate risk, and prepayment and extension risk. In general, bond prices rise when interest rates fall and vice versa. This effect is usually more pronounced for longer term securities.
In general, bond prices rise when interest rates fall and vice versa. This effect is usually more pronounced for longer term securities. Yields may vary.
Non-investment-grade (high-yield or junk) securities present greater price volatility and more risk to principal and income than higher rated securities.
Stock investments involve risk, including loss of principal. High-quality stocks may be appropriate for some investment strategies. Ensure that your investment objectives, time horizon and risk tolerance are aligned with investing in stocks, as they can lose value.
Past performance is not a guarantee of future results.
An index is a statistical composite that is not managed. It is not possible to invest directly in an index.
The Bloomberg US Aggregate Bond Index is a broad-based flagship benchmark that measures the investment grade, US dollar denominated, fixed-rate taxable bond market. The index includes Treasuries, government-related and corporate securities, MBS (agency fixed-rate and hybrid ARM pass throughs), ABS and CMBS (agency and non-agency).
The S&P 500 Index is a basket of 500 stocks that are considered to be widely held. The S&P 500 index is weighted by market value (shares outstanding times share price), and its performance is thought to be representative of the stock market as a whole. The S&P 500 index was created in 1957 although it has been extrapolated backwards to several decades earlier for performance comparison purposes. This index provides a broad snapshot of the overall US equity market. Over 70% of all US equity value is tracked by the S&P 500. Inclusion in the index is determined by Standard & Poor’s and is based upon their market size, liquidity, and sector.
Ameriprise Financial, Inc. and its affiliates do not offer tax or legal advice. Consumers should consult with their tax advisor or attorney regarding their specific situation.
Investment products are not insured by the FDIC, NCUA or any federal agency, are not deposits or obligations of, or guaranteed by any financial institution, and involve investment risks including possible loss of principal and fluctuation in value.
Securities offered by Ameriprise Financial Services, LLC. Member FINRA and SIPC.