Where do markets stand five years after pre-covid-19 highs?
ANTHONY SAGLIMBENE – CHIEF MARKET STRATEGIST, AMERIPRISE FINANCIAL
WEEKLY MARKET PERSPECTIVES — February 18, 2025

U.S. stocks finished last week higher, recovering some of their prior week’s losses. Major U.S. averages were able to look through “hot” inflation reports and further U.S. tariff announcements, as Big Tech stocks posted solid gains for the week.
Following the long President’s Day holiday weekend, housing data, preliminary looks at February economic activity, and earnings from Walmart line the shortened trading week.
Last week in review:
-
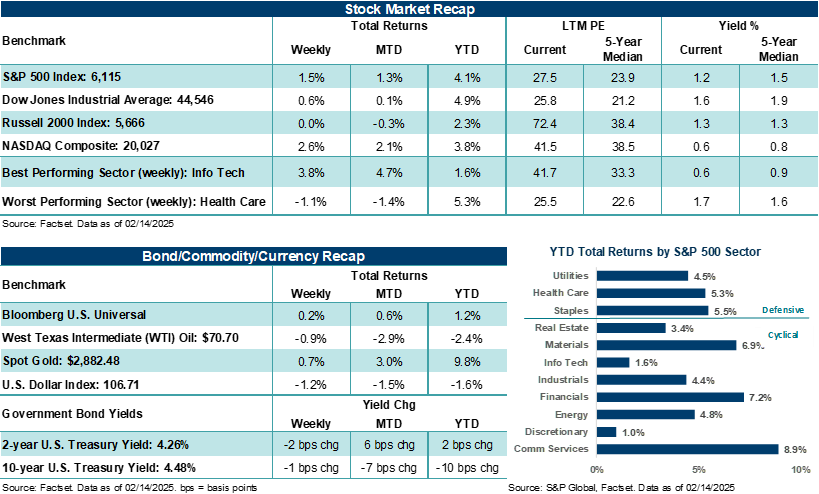
The S&P 500 Index rose +1.5%, ending just 0.2% away from its January 24, 2025, high.
-
The NASDAQ Composite’s +2.6% gain was fueled by strong performance out of NVIDIA (+6.9%) and Apple (+7.5%).
“The damaging effects of inflation have been one of the most prominent and lasting features of the post-COVID-19 environment.”
Anthony Saglimbene - Chief Market Strategist, Ameriprise Financial
- Flat performance out of the Russell 2000 Index and the Dow Jones Industrials Average +0.6% gain brought up the rear.
- Treasury yields dipped slightly, West Texas Intermediate (WTI) crude ended lower, and Gold touched a new record high.
- The U.S. Dollar Index finished the week lower, though the dollar strengthened against the yen.
- Headline and core consumer inflation unexpectedly ticked higher in January. Along with higher shelter costs (nearly 30% of the monthly all-items increase), airline fares, food, car insurance, and energy contributed to higher inflation last month. Notably, core goods inflation ended January at its highest level in two years. While January “core” producer inflation came in mostly in line on a monthly basis, December figures were revised higher.
- January retail sales declined well below estimates and recorded its first drop since August 2024. Cold weather weighed on auto sales as well as building materials demand.
- In his semiannual testimony to Congress, Fed Chair Jerome Powell reiterated policymakers’ data-dependent approach and tempered expectations for future rate cuts this year based on elevated inflation and unknown tariff impacts.
- President Trump announced new steel and aluminum tariffs, which could begin in March, as well as country-by-country reciprocal tariffs, with more details likely provided by the administration in the coming days and weeks.
- Finally, with 77% of S&P 500 fourth quarter earnings reports complete, 76% of companies have surpassed analyst earnings per share (EPS) expectations, which is in line with the five-year average. S&P 500 companies, in aggregate, are on pace to record their best quarter of year-over-year profit growth in three years.
Where do markets stand five years after the pre-COVID-19 highs?
On Wednesday, the S&P 500 Index will mark its fifth anniversary of its pre-COVID-19 high. Sure, the Index has gone on to make numerous new highs since then. But the pre-COVID-19 high, specifically, marked a seminal turning point, where an unexpected pandemic halted the global economy and sent shockwaves of disruption and change across the world not seen in generations, that in some ways, continue to ripple through markets and economies today. At least from a historical perspective, the pre-COVID-19 high stands on par with notable bull market tops seen before the bursting of the dot-com bubble, double-dip recessionary periods in the early 1950s, and the Great Financial Crisis.
A look at key market metrics since the pre-COVID-19 high
|
Index |
February 19th 2020 |
February 14th 2025 |
|
Cumulative Change |
|---|---|---|---|---|
|
S&P 500 Index |
3,386 |
6,114 |
|
+80.6% |
|
NASDAQ Composite |
9,817 |
20,026 |
|
+104.0% |
|
Bloomberg U.S. Universal Bond Index |
216.5 |
214.7 |
|
-0.82% |
|
10-Year U.S. Treasury Yield |
1.57% |
4.48% |
|
+2.91% |
|
West Texas Intermediate (WTI) Crude |
$53.31 |
$70.70 |
|
+32.6% |
|
Gold |
$1604.20 |
$2882.48 |
|
+79.7% |
|
U.S. Dollar Index |
99.71 |
106.71 |
|
+7.0% |
|
U.S. Unemployment Rate* |
3.5% |
4.0% |
|
+0.5% |
|
U.S. Headline CPI (Y/Y) * |
+2.3% |
+3.0% |
|
+0.7% |
|
U.S. Fed Funds Rate |
1.50% to 1.75% |
4.25% to 4.50% |
|
+275 bps |
Sources: FactSet and American Enterprise Investment Services, Inc. Data as of 2/14/25.
*U.S. unemployment rate and headline CPI figures as of February 2020 and January 2025. These figures are shown for illustrative purposes only. An index is a statistical composite that is not managed. It is not possible to invest directly in an index. Past performance is not a guarantee of future results.
From that pre-COVID-19 top, the S&P 500 fell nearly 34% in twenty-four days as global economic activity sharply ground to a halt. The pandemic ended a roughly eleven-year stretch that saw the S&P 500 gain over +400% cumulatively during that period — one of the longest bull market runs in history. U.S. GDP fell 5.5% in Q1’20 before crashing roughly 28% in Q2’20 on an annualized basis. As Bespoke Investment Group recently noted, the two-quarter drop of 9.2% in U.S. economic activity was nearly three times as large as the three-quarter decline during the financial crisis. The unemployment rate rose from 3.5% in February 2020 (a multi-decade low) to a staggering 14.8% in April 2020, as much of the country was under stay-at-home orders. However, U.S. stocks quickly discounted the pandemic — fully understanding the world would eventually return to normal, even if many Americans had their doubts. Notably, the S&P 500 was back at all-time highs by August 2020, as employment began to recover and economic activity resumed.
From there, we’re all pretty familiar with the story. Massive and unprecedented levels of monetary and fiscal support buoyed Americans while they were at home spending on goods and then helped fuel massive services demand once COVID-19 vaccines were readily available. Notably, pandemic responses, policy decisions, and enormous supply chain disruptions all combined to fuel record-high inflation by the summer of 2022. A slow return to more normalized economic activity and aggressive rate hikes from the Federal Reserve in 2022 and 2023 helped lower inflation over time. That said, while inflation measures in the U.S. are currently much closer to normal, items within the Consumer Price Index, on average, cost roughly +23% more today than they did in February 2020. Thus, it goes without saying, but we’ll say it anyway: The damaging effects of inflation have been one of the most prominent and lasting features of the post-COVID-19 environment.
So, why are we taking this stroll down memory lane? Simply, milestone anniversaries often offer an opportunity for reflection. Since the pre-COVID-19 top, the S&P 500 and NASDAQ Composite have weathered bouts of uncertainty and volatility well, enjoying substantial “cumulative” gains over the last five years. Streamlined business operations, strong profitability, a stable demand environment, and artificial intelligence tailwinds have spurred growth and, hence, higher stock prices. Conversely, fixed income has struggled in the post-COVID-19 environment, as government bond yields and Fed policy rates are materially higher than where they stood prior to the pandemic. Several bouts of market volatility, elevated inflation, increased foreign central bank purchases, and growing concerns about the fiscal standing of the U.S. government have fueled substantial gains in Gold over the last five years — which are on par with the returns seen across stocks. Also, the price of oil is up meaningfully in a post-pandemic world due to wars, sanctions, supply constraints, and increased financial discipline across producers. Finally, the U.S. Dollar Index is higher, as the strength, stability, and rate environment of the U.S. compared to other countries since the pandemic has made our currency more attractive to investors.
In our view, the last five years have brought with it unexpected shocks, dislocations and opportunities across asset prices and economies, an ability to benefit and invest from transformational technology, and propelled shifts in how governments, businesses, and consumers interact with the world. Over the next five years, we suspect the table above will likely reflect continued shifts in the market (and possibly unexpected reactions/performance) in response to evolving macroeconomic, profit, and rate conditions. That said, U.S. stocks are currently over three times the size of the rest of the world by market capitalization (a 75-year high), and the largest five stocks in the S&P 500 account for over 25% of the Index. Along with unprecedented levels of market concentration, high valuations, tariff uncertainty, and elevated inflation and interest rates, there are certainly no shortages of risks for investors to navigate at the moment.
Importantly, today’s current bull market and its eventual top will only be known in hindsight. Yet, history is clear, bull markets don’t die without a meaningful catalyst that dramatically shifts expectations of the future (e.g., a 100-year pandemic). And to be clear, despite known risks, we believe investment conditions favor a guarded but still optimistic outlook. Nevertheless, if the last five years are any indication, investors should be prepared for the unexpected, consider diversifying across assets (to help mitigate the risk of being caught off guard), and be willing to look through temporary bouts of volatility to reap the benefits that a longer-term investment approach has historically provided.
The week ahead:
With key employment and inflation data out of the way, the shortened trading week offers a welcomed break in market-moving economic releases.
- Although weather, the L.A. wildfires, and tariff uncertainties could weigh on preliminary looks at February economic activity, all three measures of U.S. S&P Global PMIs (manufacturing, services, and composite) sat in expansionary territory last month — which was a first since June.
- Housing data, Fed meeting minutes, and an important look at consumer trends through Walmart’s earnings report line the week’s other notable items to watch.
These figures are shown for illustrative purposes only and are not guaranteed. They do not reflect taxes or investment/product fees or expenses, which would reduce the figures shown here. An index is a statistical composite that is not managed. It is not possible to invest directly in an index. Past performance is not a guarantee of future results.
Sources: FactSet and Bloomberg. FactSet and Bloomberg are independent investment research companies that compile and provide financial data and analytics to firms and investment professionals such as Ameriprise Financial and its analysts. They are not affiliated with Ameriprise Financial, Inc.
The views expressed are as of the date given, may change as market or other conditions change, and may differ from views expressed by other Ameriprise Financial associates or affiliates. Actual investments or investment decisions made by Ameriprise Financial and its affiliates, whether for its own account or on behalf of clients, will not necessarily reflect the views expressed. This information is not intended to provide investment advice and does not account for individual investor circumstances.
Some of the opinions, conclusions and forward-looking statements are based on an analysis of information compiled from third-party sources. This information has been obtained from sources believed to be reliable, but accuracy and completeness cannot be guaranteed by Ameriprise Financial. It is given for informational purposes only and is not a solicitation to buy or sell the securities mentioned. The information is not intended to be used as the sole basis for investment decisions, nor should it be construed as advice designed to meet the specific needs of an individual investor.
Commodity investments may be affected by the overall market and industry- and commodity-specific factors, and may be more volatile and less liquid than other investments.
Diversification does not assure a profit or protect against loss.
There are risks associated with fixed-income investments, including credit (issuer default) risk, interest rate risk, and prepayment and extension risk. In general, bond prices rise when interest rates fall and vice versa. This effect is usually more pronounced for longer term securities.
Investments may not keep pace with inflation, resulting in loss of purchasing power.
Stock investments involve risk, including loss of principal. High-quality stocks may be appropriate for some investment strategies. Ensure that your investment objectives, time horizon and risk tolerance are aligned with investing in stocks, as they can lose value.
The products of technology companies may be subject to severe competition and rapid obsolescence, and their stocks may be subject to greater price fluctuations.
Past performance is not a guarantee of future results.
An index is a statistical composite that is not managed. It is not possible to invest directly in an index.
Definitions of individual indices and sectors mentioned in this article are available on our website at ameriprise.com/legal/disclosures in the Additional Ameriprise research disclosures section.
The S&P 500 Index is a basket of 500 stocks that are considered to be widely held. The S&P 500 index is weighted by market value (shares outstanding times share price), and its performance is thought to be representative of the stock market as a whole. The S&P 500 index was created in 1957 although it has been extrapolated backwards to several decades earlier for performance comparison purposes. This index provides a broad snapshot of the overall US equity market. Over 70% of all US equity value is tracked by the S&P 500. Inclusion in the index is determined by Standard & Poor’s and is based upon their market size, liquidity, and sector.
The S&P 500 Information Technology Index comprises those companies included in the S&P 500 that are classified as members of the Global Industry Classification Standard (GICS) information technology sector.
The NASDAQ Composite index measures all NASDAQ domestic and international based common type stocks listed on the Nasdaq Stock Market.
The Dow Jones Industrial Average (DJIA) is an index containing stocks of 30 Large-Cap corporations in the United States. The index is owned and maintained by Dow Jones & Company.
The Russell 2000 Index measures the performance of the small-cap segment of the US equity universe. The Russell 2000 is constructed to provide a comprehensive and unbiased small-cap barometer and is completely reconstituted annually to ensure larger stocks do not distort the performance and characteristics of the true small-cap opportunity set. The Russell 2000 includes the smallest 2000 securities in the Russell 3000.
West Texas Intermediate (WTI) is a grade of crude oil commonly used as a benchmark for oil prices. WTI is a light grade with low density and sulfur content.
The US Dollar Index (USDX) indicates the general international value of the USD. The USDX does this by averaging the exchange rates between the USD and major world currencies. This is computed by using rates supplied by approximately 500 banks.
The Consumer Price Index (CPI) is an inflation indicator that measures the change in the total cost of a fixed basket of products and services, including housing, electricity, food, and transportation. The CPI is published monthly by the Commerce Department and is also commonly referred to as the cost-of-living index.
The Institute for Supply Management (ISM) manufacturing index is a national manufacturing index based on a survey of purchasing executives at roughly 300 industrial companies. It is an index of the prevailing direction of economic trends in the manufacturing and service sectors.
The ISM Services PMI (formerly the Non-Manufacturing NMI) is compiled and issued by the Institute of Supply Management (ISM) based on survey data. The ISM services report contains the economic activity of more than 15 industries, measuring employment, prices, and inventory levels; above 50 indicating growth, while below 50 indicating contraction.
Third party companies mentioned are not affiliated with Ameriprise Financial, Inc.
Investment products are not insured by the FDIC, NCUA or any federal agency, are not deposits or obligations of, or guaranteed by any financial institution, and involve investment risks including possible loss of principal and fluctuation in value.
Securities offered by Ameriprise Financial Services, LLC. Member FINRA and SIPC.